


Introduction
Polycystic ovary syndrome (PCOS) is the most common endocrine disorder in reproductive-age women and can cause chronic ovulatory dysfunction or irregular menstruation [1]. PCOS is an important issue for womenâs health, as it can lead to not only reproductive problems, but also psychological and metabolic disturbances throughout the lifespan [2].
In patients with PCOS, multiple hormonal factors inhibit the selection of the dominant follicle and induce follicular arrest [3,4], producing a characteristic ultrasound pattern in which small preantral follicles are gathered around the edge of the ovary. This feature resembles that seen in the immature ovaries in adolescence. According to the revised diagnostic criteria [5], polycystic ovarian morphology (PCOM) is considered to be present in the early follicular phase when the number of 2- to 9-mm antral follicles is over 20 or increased ovarian volume (â¥10 mL) is observed in either ovary on ultrasonography.
PCOS is intricately associated with diverse phenotypes of metabolic abnormalities. Glucose intolerance and type 2 diabetes mellitus, atherosclerotic dyslipidemia, and coronary heart disease are common clinical features of PCOS along with hormonal abnormalities, and these metabolic diseases are generally known to be associated with abnormal insulin sensitivity [4]. Although the pathophysiology of PCOS is complex and has not been fully established, insulin resistance is the major component affecting various metabolic features and clinical phenotypes.
As interest in the role of insulin resistance in PCOS has increased, many studies have been conducted on this issue. However, research on the relationship between insulin resistance and ultrasonographic morphologic features of PCOS is still scarce and inconclusive [6-8]. Therefore, the purpose of this study was to determine whether the PCOM characteristics of increased antral follicle count and ovarian volume are related to insulin resistance parameters in women with PCOS.
Methods
1. Participants
Korean women between the ages of 18 and 35 years who were newly diagnosed with PCOS at Inje University Haeundae Paik Hospital between January 2010 and December 2013 were recruited for this study. Among all patients diagnosed with PCOS based on the previous 2003 Rotterdam criteria, those who met the recently revised diagnostic criteria in the international consensus guidelines for PCOS were enrolled in this study with the exclusion of other etiologies (including congenital adrenal hyperplasia, androgen-secreting tumor, and Cushing syndrome) [5,9]. Clinical hyperandrogenism was defined by the presence of hirsutism (modified Ferriman-Gallwey score >6) [5], and biochemical hyperandrogenism was defined as a serum androgen level above the 95% confidence limits defined in controls in the study by Chae et al. [10] (total testosterone >0.68 ng/mL and/or free testosterone >1.72 pg/mL). The exclusion criteria were as follows [11-13]: diagnosis of diabetes, thyroid disease, or hyperprolactinemia; history of ovarian surgery; or history of taking medications known to affect the level of any sex hormone or gonadotropin (oral contraceptives, ovulation induction agents, glucocorticoids, or anti-androgens) or anti-diabetic drugs, including insulin sensitizers, in the 6 months prior to enrollment. This retrospective study was approved by the Institutional Review Board (IRB) of Inje University Haeundae Paik Hospital (IRB No. 129792-2014-035), which waived the requirement for informed consent from patients. Ultimately, a total of 147 patients with PCOS were enrolled in the present study.
2. Measurement of anthropometric parameters and ultrasound examination
Clinical variables including age, parity, height, body weight, body mass index, waist circumference, hip circumference, and waist-to-hip ratio were evaluated for all study patients when they first visited the outpatient department. Pelvic ultrasound examinations (transvaginal or transrectal) were conducted in the early follicular phase using a Voluson LOGIQ S7 device (GE Ultrasound Korea Ltd.) equipped with a microconvex intracavitary probe with an approximate frequency range of 3.6 to 9.0 MHz. PCOM was defined as the presence of over 20 follicles (of 2 to 9 mm) and/or an ovarian volume â¥10 cm3 [5,9,14]. All ultrasound examinations were performed by the same expert in reproductive endocrinology based on the international consensus on ultrasound assessment of PCOS [15].
3. Biochemical measurements and assessment of insulin resistance
Blood samples for biochemical analyses were taken from all participants in the early follicular phase after overnight fasting according to the guidelines of the Declaration of Helsinki. Glucose levels were measured 60 and 120 minutes after glucose ingestion during a 2-hour 75-g oral glucose tolerance test, and in some study participants (n=60), postprandial insulin levels at 60 and 120 minutes were measured simultaneously with glucose levels during the 2-hour oral glucose tolerance test. Serum glucose and insulin levels were analyzed using an L-Type GluI device (Wako) and an Elecsys Insulin assay (Roche), respectively. Cholesterol and triglyceride levels were measured using Pureauto S (Sekisui), and serum high-density lipoprotein and low-density lipoprotein (LDL) levels were measured using Cholestest (Sekisui). Both intra- and inter-assay coefficients of variation were below 8% for all assays.
Insulin sensitivity assessment indices (ISAIs) were calculated for all study participants. Established fasting ISAIs derived from a combination of fasting insulin and glucose levels were calculated as follows [11-13]: the homeostatic model assessment of insulin resistance (HOMA-IR) was calculated as glucose level (mg/dL)Ãinsulin level (ÎŒU/mL)/405, the glucose-to-insulin ratio (GIR) was calculated by dividing the glucose level (mg/dL) by the insulin level (ÎŒU/mL), and the quantitative insulin sensitivity check index (QUICKI) was calculated as 1/[log(insulin level [ÎŒU/mL])+log(glucose level [mg/dL])].
4. Statistical analysis
Values are expressed as mean±standard deviation or median (range). Correlation analysis was conducted to assess the relationships between PCOM-related parameters and insulin resistance-related clinical and biochemical parameters using Spearman rank correlation coefficients and linear regression analysis, with partial correlations used to control for the effects of confounding covariates. The unpaired t-test or the Mann-Whitney U test was used to compare continuous parameters between the two groups, which were defined by the median total antral follicle count (TFC) (TFC â€54 and TFC >54). All statistical analyses were conducted using SPSS version 25.0 (IBM Corp.), with p-values <0.05 considered to indicate statistical significance.
Results
Table 1 shows the baseline clinical anthropometric and ultrasonographic characteristics and laboratory biochemical parameters of the study participants. The median values for parity and TFC were 0 and 54, respectively.
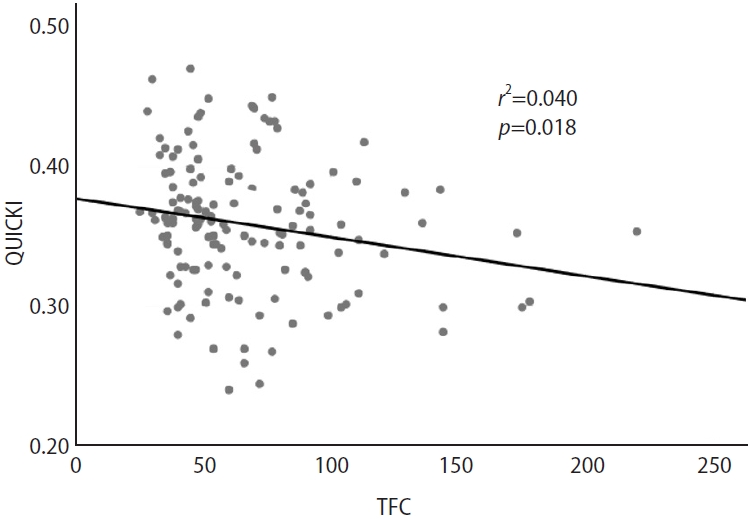
No anthropometric parameter was significantly correlated with any PCOM-related parameter (Table 2). Among the metabolic parameters related to insulin resistance, fasting insulin levels, HOMA-IR, GIR, QUICKI, and LDL levels were significantly related to TFC (Table 3, Figure 1). Neither postprandial blood glucose levels nor insulin levels were significantly associated with TFC (Table 3). None of the insulin resistance-related parameters were significantly correlated with total ovarian volume (TOV), either fasting or postprandial. These results did not change after adjustments for other anthropometric covariates (Table 3).
All patients were divided into two groups based on the median TFC (TFC â€54 and TFC >54). As shown in Table 4, fasting insulin levels, HOMA-IR, and QUICKI differed significantly between the two groups. The mean LDL level was higher in the TFC >54 group than in the TFC â€54 group, but this difference was not statistically significant (p=0.058).
Discussion
PCOS is a heterogeneous disorder characterized by metabolic and reproductive phenotypes, along with hormonal imbalances. Type 2 diabetes mellitus, nonalcoholic liver dysfunction, and dyslipidemia are metabolic disorders common in women with PCOS, and insulin resistance is considered the cardinal mechanism that induces these metabolic disorders [4,16]. Accordingly, several studies on the correlation between hormonal or clinical features and insulin resistance have been published [17-21], but research on the relationship between ultrasonographic morphologic features and insulin resistance in PCOS is still lacking. In this study, we investigated whether the ultrasound findings characteristic of PCOS are related to insulin resistance parameters, and we found that TFC, but not TOV, was associated with fasting (but not postprandial) insulin resistance-related parameters in women with PCOS. Hong et al. [6] previously demonstrated that TFC could be a major indicator of insulin resistance and metabolic disturbance in women with PCOS, which supports our results. Another study compared hormonal and metabolic features between women with PCOM and those with normal ovaries, revealing that the fasting insulin level and calculated index of insulin resistance were significantly correlated with PCOM, but the fasting glucose level was not significantly different between the two groups [7]. This was also highly consistent with our results.
Despite the differences in population, PCOM with regular ovulatory cycles may represent the mildest form of hyperandrogenism and is associated with greater insulin resistance than normal morphologic features [6,7]. PCOM is related to hyperinsulinemia and low sex hormone-binding globulin levels [7], even in the absence of other metabolic abnormalities or imbalanced gonadotropin secretion. Similarly, Norman et al. [22] suggested that in the presence of PCOM, a more severe disturbance in insulin signaling may constitute a predisposition to the menstrual irregularity characteristic of PCOS.
We observed no significant relationship between ovarian volume and insulin resistance. Several studies have noted that ovarian volume or ovarian blood flow is associated with insulin resistance [6,8,23,24], and the discrepancy between these studies and ours may stem from the use of different study designs, diagnostic criteria, and ethnicities of study populations [25]. Some studies have reported that while ovarian volume may be a good surrogate marker for PCOS, the follicle count is more sensitive and specific to PCOM features and could be a more powerful predictor than TOV of insulin resistance in PCOS [6,26]. These suggestions are partially consistent with our findings.
In the present study, serum LDL levels were significantly associated with TFC. A previous study also reported that higher lipid levels, including LDL levels, were observed in patients with PCOS with greater follicle counts despite similar body mass indices [27]. To our knowledge, ours is the first study to conduct a comparison of insulin resistance-related parameters between groups categorized by TFC, and we found that fasting insulin and some ISAIs were significantly different between groups.
Our study has several limitations, including a retrospective design and a relatively small sample size. Based on a previous study [7], the sample size was calculated as 89 people per group (178 people in total). Notably, only 60 participants received a blood test measuring their postprandial insulin levels, which was an insufficient sample size to demonstrate the reliability of the study.
In conclusion, the morphologic features of PCOS, especially an elevated follicle count, are significantly related to insulin resistance in women with PCOS. Further large-scale prospective trials that include sufficient data on both fasting and postprandial blood glucose and insulin are needed to clarify and corroborate our results.