


Introduction
Polycystic ovary syndrome (PCOS) is one of the most common endocrine disorders in reproductive-aged women, affecting 5%–10% of women worldwide [1]. PCOS is a reproductive disorder characterized by chronic ovulation and hyperandrogenism, resulting in amenorrhea and infertility; it is also a metabolic disorder based on insulin resistance that leads to future overt diabetes and cardiovascular disease. Insulin resistance and the resulting hyperinsulinemia are known to play a pivotal role in the pathogenesis of PCOS [1-4]. Insulin resistance has been detected in approximately 80% of women with PCOS and in 95% of obese women [5]; therefore, some authors have suggested referring to PCOS as syndrome XX, just as metabolic syndrome is called syndrome X [6]. PCOS is a leading risk factor for prediabetes (comprising impaired fasting glucose [IFG] and impaired glucose tolerance [IGT]) and type 2 diabetes mellitus (T2DM) in reproductive-age women [2,6].
A 2-hour, 75-g oral glucose tolerance test (OGTT) is the standard method used to evaluate glucose tolerance and diagnose diabetes. Recent clinical guidelines have recommended a standard OGTT to screen for IGT and T2DM in women with PCOS [7-9]. However, since OGTT involves the inconvenience of evaluating blood glucose every hour for 2 hours, there have been demands to replace it with fasting-state measurement of glucose levels alone in the actual clinical setting of managing PCOS patients; however, some researchers have argued that it is not enough to measure fasting blood glucose levels alone to screen for T2DM [3,10].
Insulin sensitivity is a concept that reflects the opposite of insulin resistance [2]. Currently, the hyperinsulinemic-euglycemic clamp method is regarded as the gold standard for assessing insulin sensitivity/resistance, but this clamp method is used primarily for research purposes only, because it is difficult to apply in real clinical situations due to its cost, invasiveness, time-consuming nature, and dependence on experienced personnel [1,2,11]. Therefore, fasting-state insulin sensitivity assessment indices (ISAIs) derived from fasting glucose and insulin concentrations, such as the homeostatic model assessment of insulin resistance (HOMA-IR), quantitative insulin sensitivity check index (QUICKI), and glucose-to-insulin ratio (GIR), have been widely used to evaluate insulin sensitivity/resistance in epidemiological studies because these indices are uncomplicated and inexpensive quantitative (homeostatic) methods that are strongly correlated with insulin sensitivity as measured with a hyperinsulinemic-euglycemic clamp [2,11,12].
In the present study, we conducted a receiver operating characteristic (ROC) curve analysis to evaluate how well abnormal glucose tolerance can be predicted by measurements of fasting-state parameters alone, such as fasting glucose and insulin concentrations and other fasting-state ISAIs derived from a combination of glucose and insulin levels, without postload glucose measurements, following an oral glucose challenge in women with PCOS.
Methods
1. Subjects
South Korean women between the ages of 18 and 35 years who first visited Inje University Haeundae Paik Hospital between January 2010 and December 2013 and were diagnosed with PCOS according to the Rotterdam consensus diagnostic criteria [13] were recruited for this retrospective study. Among these patients, only those who met the recently revised diagnostic criteria provided in the international consensus guidelines for PCOS [9] were enrolled. Pelvic ultrasound examinations (through the vagina or rectum) for assessing polycystic ovarian morphology were conducted in the early follicular phase using a Voluson Logiq S7 (GE Ultrasound Korea, Seongnam, Korea) equipped with a transvaginal probe with a frequency range of 3.6–9 MHz, and all of the ultrasound examinations were conducted by the same reproductive endocrinologist in accordance with the international consensus for ultrasound assessment [14]. The exclusion criteria for the present study were as follows [15,16]: patients who were previously diagnosed with thyroid disease or hyperprolactinemia, had a history of ovarian surgery or suspicious ovarian malignancy, or had been taking medications known to affect sex hormone or gonadotropin levels in the 6 months prior to enrollment (oral contraceptives, ovulation induction agents, glucocorticoids, or anti-androgens). Furthermore, patients who were currently taking insulin or oral hypoglycemic drugs were also excluded from the present study. Finally, a total of 153 patients were included.
This study was approved by the Institutional Review Board of Inje University Haeundae Paik Hospital (IRB No. 129792-2014-035), and patient’s informed consent in this study was waived by the IRB. Clinical anthropometric parameters were evaluated in all patients when they first visited the outpatient department. Body mass index (BMI) was defined by dividing body weight (kg) by the square of the height (m2), and the waist-to-hip ratio (WHR) was calculated by dividing the waist circumference (cm) by the hip circumference (cm).
2. Biochemical measurements and determination of abnormal glucose tolerance
Blood samples were taken from all study participants following overnight fasting in accordance with the guidelines of the Declaration of Helsinki, and sera were obtained by centrifugation to evaluate biochemical parameters. Fasting glucose levels and levels at 2 hours after 75-g glucose ingestion during a 2-hour OGTT were measured using L-Type GluI (Wako Pure Chemical Industries, Osaka, Japan). Fasting insulin levels were evaluated using an Elecsys Insulin assay (Roche Diagnostics Corp., Basel, Switzerland). The intra- and inter-assay coefficients of variation were <5% for all measurements.
Fasting-state homeostatic ISAIs derived from a combination of fasting glucose and insulin levels were calculated according to the following formulas:
HOMA-IR=glucose (mg/dL)×insulin (μU/mL)/405,
GIR=glucose (mg/dL)/insulin (μU/mL); and,
QUICKI=1/{log [insulin (μU/mL)]+log [glucose (mg/dL)]}.
3. Statistical analysis
Values are expressed as the mean±standard deviation (SD). The unpaired t-test was used to compare continuous parameters between two groups created using a 2-hr PG threshold level of 140 mg/dL. The correlations between the 2-hr PG level and other parameters were evaluated using Pearson correlation coefficients and linear regression analysis, and partial correlation coefficients were used after controlling for confounding variables such as BMI and WHR. For the assessment of the prediction accuracy of fasting-state parameters for abnormal glucose tolerance, areas under the ROC curves (AUCs), sensitivity, and specificity were evaluated. Predictive accuracy using AUCs was categorized in the present study as follows [20,21]: non-informative (AUC=0.5), less accurate (0.5 <AUC <0.7), moderately accurate (0.7 <AUC <0.9), highly accurate (0.9 <AUC <1), and perfect (AUC=1). The optimal cutoff value of the fasting-state parameter for identifying abnormal glucose tolerance was defined as the threshold value at which the value of the sensitivity plus the specificity reached a maximum. All statistical analyses were conducted using IBM SPSS ver. 25.0 (IBM Corp., Armonk, NY, USA), and p-values of less than 0.05 were considered to indicate statistical significance in all analyses.
Results
Table 1 shows a comparison of patient baseline anthropometric characteristics and fasting-state laboratory parameters related to glucose and insulin metabolism between the two groups categorized according to a 2-hr PG level of 140 mg/dL. In Table 1, significant differences between the groups were found for all fasting-state laboratory parameters except GIR. Among the anthropometric parameters, WHR and BMI were significantly different between the two groups.
In Table 2, the 2-hr PG level following the 75-g OGTT was significantly related to BMI, WHR, fasting glucose, fasting insulin, HOMA-IR, and QUICKI, which was in agreement with the results shown in Table 1. These results did not change even after we controlled for the effects of variables such as BMI and WHR.
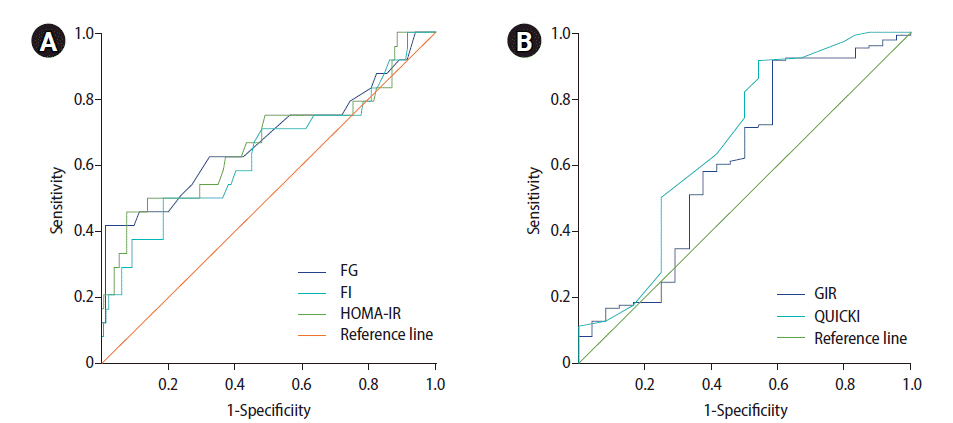
Table 3 and Figure 1 show the results from the ROC curve analyses of various fasting-state parameters to identify their ability to predict abnormal glucose tolerance in the study participants. Despite significant correlations with 2-hr PG on a 75-g OGTT and other fasting-state parameters observed in this study, the calculated AUC values of each fasting-state parameter for predicting abnormal glucose tolerance in women with PCOS were all between 0.5 and 0.7, meaning that the predictive accuracies of all fasting-state parameters fell into the “less accurate” category based on the criteria used in the present study.
Discussion
It is well established that insulin resistance and compensatory hyperinsulinemia are central components in the pathogenesis of PCOS. Insulin resistance/hyperinsulinemia leads to a high incidence of T2DM and cardiovascular disease in PCOS patients. Up to 35% of women with PCOS exhibit IGT, while up to 10% meet the criteria for T2DM [2]. Prediabetes (comprising IFG and IGT) and diabetes can be assessed by measuring levels of fasting glucose, postprandial or postload glucose after a glucose challenge, and hemoglobin A1C (HbA1c) [19,22]. The 2-hour OGTT is considered a standard method for screening for IGT and T2DM in women with PCOS [7-9], but the criteria for application of the OGTT are different in each clinical guideline. While an Endocrine Society Clinical Practice Guideline recommends the use of an OGTT to screen for IGT and T2DM in all adolescent and adult women with PCOS [7], it is only recommended in women with PCOS at high risk for future T2DM according to other clinical guidelines [8,9], and fasting plasma glucose or HbA1c can be tested to assess glycemic status in groups that are not at high risk for future T2DM instead of OGTT [9]. Although the OGTT is advantageous over fasting-state measurements of glucose (and other variables) in terms of its ability to define abnormal glucose tolerance and more clearly establish a management plan, it has drawbacks (higher cost, more effort, and time consumption) that may offset its advantages. For this reason, it would be very attractive if those with a high risk of abnormal glucose tolerance could be identified using measurements of fasting-state parameters alone instead of OGTT because this approach can avoid the cost, labor, and inconvenience caused by performing OGTT to screen for T2DM in all PCOS patients. In the present study, we aimed to evaluate the predictive accuracy of the fasting glucose level and other fasting-state indices for assessing insulin sensitivity in women with PCOS using ROC curve analysis for abnormal glucose tolerance following an OGTT, and we found that all of the AUC values for each fasting-state homeostatic parameter fell into the “less accurate” category despite the significant correlations of the 2-hr PG level during the OGTT with fasting glucose, fasting insulin, and other fasting-state ISAIs in the present study. In this study, all AUC values for identifying abnormal glucose tolerance were in the range of 0.5–0.7, which means that these parameters were not much better than a coin toss according to the criteria presented above [23,24].
Postprandial hyperglycemia and the resulting hyperinsulinemia jointly inhibit hepatic glucose production and stimulate glucose uptake by splanchnic and peripheral (primarily muscle) tissues to dispose of the ingested glucose and restore normoglycemia [12]. In the normal population, postprandial glucose concentrations peak 60 minutes after the start of a meal and return to preprandial levels within 2–3 hours; in contrast, postprandial glucose levels generally peak approximately 2 hours after the start of a meal and do not fall back to the baseline value for 4 to 6 hours in patients with diabetes [25]. The point is that postprandial glucose concentration is influenced both by hepatic and peripheral (muscle) tissue insulin resistance, while fasting blood glucose concentration is mainly affected by hepatic glucose production [12].
IFG and IGT are intermediate states in glucose metabolism that fall between normal glucose homeostasis and overt diabetes [12,26]. Both insulin resistance and impaired β-cell function have been found in subjects with IFG and IGT, but the site of insulin resistance is known to be different between the two disorders based on data from existing clinical studies [10,12,26,27]. Those with IFG predominantly have hepatic insulin resistance with normal muscle insulin sensitivity, while those with IGT have moderate to severe muscle insulin resistance with normal to slightly reduced hepatic insulin sensitivity [12]. In addition, those with isolated IFG show a decreased early-phase (first 30 minutes), but a less severely impaired late-phase (60–120 minutes) plasma insulin response to the oral glucose load during the OGTT; on the contrary, those with isolated IGT have severe impairments in both early- and late-phase insulin responses to glucose load [12,26]. The present study showed low predictive accuracies for all fasting-state indices for abnormal glucose tolerance, which may be attributed to the discrepancy of the pathophysiological mechanisms involved in the abnormal homeostatic control of fasting-state and postprandial blood glucose concentrations mentioned above. HOMA-IR, the most widely used surrogate marker in clinical studies [3,11], mainly reflects hepatic insulin resistance, while the insulin clamp method mainly reflects muscle insulin resistance [12]. Therefore, despite the reported significant association between HOMA-IR and insulin resistance measured by the hyperinsulinemic-euglycemic clamp method, the discrepancy between HOMA-IR and glucose disposal during insulin clamping may occur in the context of a discrepancy between liver and muscle insulin resistance [12,26].
In this study, the cutoff value of fasting glucose for predicting abnormal glucose tolerance was calculated as 103.5 mg/dL; despite its low sensitivity (0.417), it was closer to the ADA criterion of 100 mg/dL [19] than to the World Health Organization criterion of 110 mg/dL [28] for IFG.
An Endocrine Society Clinical Practice Guideline recommends that HbA1c may be considered for screening for IGT and T2DM in adolescents and adult women with PCOS if a patient is unable or unwilling to complete an OGTT [7]. McCartney and Marshall [3] insisted that measurements of fasting blood glucose levels alone should not be recommended for T2DM screening in women with PCOS, and laboratory assessments of insulin resistance (e.g., measurements of fasting insulin levels and other ISAIs) are also not routinely recommended given the imprecision of these assessments and their uncertain clinical usefulness. Instead, they recommended measuring HbA1c for initial screening because it is more convenient for patients than an OGTT in women with PCOS and proposed that a 2-hour OGTT should be considered only for patients who have an HbA1c level that is approaching (but below) the diagnostic threshold for diabetes of 6.5% (e.g., a HbA1c level ≥6%). Of course, their argument may also be controversial in that the high cost of the HbA1c test makes it unavailable or very limited in resource-poor settings [29]; additionally, it runs counter to the recommendations of the Endocrine Society, which prioritizes an OGTT over an HbA1c measurement because of the possibility of a stronger association between IGT and cardiovascular disease in women and the potential to identify women at risk for gestational diabetes before pregnancy [7]. An HgbA1c test may be a feasible alternative to an OGTT, especially for patients who are unwilling or unable to complete an OGTT; however, no assessment of fasting-state HbA1c was made besides fasting glucose and insulin in the present study.
In the present study, we merely measured the fasting insulin level, and we did not assess postload insulin levels following the OGTT. The lack of postload insulin data may be the most important drawback of this retrospective study because the 2-hour postload insulin level has been suggested to be a good indicator of insulin resistance [30].
In conclusion, our results suggest that fasting-state measurements of glucose and insulin measurements alone are not enough to predict abnormal glucose tolerance in women with PCOS; it seems quite difficult to replace the OGTT with only fasting-state measurements of glucose and insulin levels to identify abnormal glucose tolerance in PCOS patients. A standard OGTT is needed to screen for IGT and T2DM in women with PCOS.