Clin Exp Reprod Med Search

CLOSE


Clin Exp Reprod Med > Volume 51(1); 2024 > Article
Uzun, Huner, Kıvrak, Zengin, Ozsagir, Sönmez, and Akça: The relationship between anthropometric and metabolic risk factors and testicular function in healthy young men

Abstract

Objective

This study investigated the relationship of anthropometric and metabolic risk factors with seminal and sex steroidal hormone parameters in a screened population of healthy males.

Methods

The participants were healthy young men without chronic or congenital diseases. The body composition parameters that we investigated were measured weight, height, and waist circumference (WC), as well as bioelectrical impedance analysis. Semen samples were analyzed for semen volume, sperm concentration, sperm motility and morphology, seminal pH, and liquefaction time. Biochemistry analysis, including glucose and lipid metabolism parameters, was conducted on fasting blood samples. Testicular volume was calculated separately for each testis using ultrasonography.

Results

Body mass index exhibited an inverse association with total sperm count. WC showed negative correlations with numerous seminal parameters, including sperm concentration, total sperm count, sperm morphology, and follicle-stimulating hormone levels. The basal metabolic rate was associated with seminal pH, liquefaction time, and sperm motility. WC, fat mass percentage, and triglyceride levels exhibited negative correlations with sex hormone binding globulin. The measures of glucose metabolism were associated with a greater number of seminal parameters than the measures of cholesterol metabolism. C-reactive protein levels were inversely associated with sperm concentration and total sperm count.

Conclusion

Anthropometric and metabolic risk factors were found to predict semen quality and alterations in sex steroidal hormone levels.

Introduction

Sperm counts have been declining worldwide in recent decades, and infertility has become a serious health concern [1-4]. Male factor infertility has been identified in approximately 50% of infertile couples [5]. There has also been a parallel increase in chronic diseases and cancer. Studies have shown that men with poor semen quality are at risk for long-term morbidity and mortality [6-9]. Increased cancer and mortality rates related to lifestyle factors, obesity, and diabetes have been reported in men with impaired infertility [9,10], and there is growing evidence linking metabolic disturbances with male infertility. Obesity-related metabolic disorders, including metabolic syndrome, diabetes, hypogonadism, osteoporosis, and cardiovascular disease [11], may contribute to a potential decline in semen quality.
Metabolic syndrome, which is related to unhealthy dietary habits and a sedentary lifestyle, is also associated with poor general health and chronic systemic diseases. It is characterized by central obesity, dyslipidemia, insulin resistance, and hypertension [12]. In addition, both metabolic syndrome and male infertility have been associated with hypogonadism and high mortality risk [13,14]. Further studies have also shown that eugonadal men with a low sperm count had a higher risk for metabolic and cardiovascular diseases [13,14]. Body mass index (BMI), waist circumference (WC), and non-alcoholic fatty liver disease (the liver component of metabolic syndrome) have been associated with a decline in sperm output; however, the evidence regarding this point is still being debated and is far from conclusive [11].
Given the conflicting data and biological plausibility of this association, we conducted a screening study of healthy men. We investigated anthropometric and metabolic risk factors to identify predictive variables for seminal and sex steroidal hormone parameters.

Methods

1. Study population

This study was designed to measure the predictive associations between anthropometric, metabolic, hormonal, and seminal parameters in a population of healthy young men. Men being trained at a school for security services, arriving from different zones of the country, were included in the study. The participants underwent a thorough medical examination before acceptance to the school and had no chronic or congenital diseases, drug addiction, or anabolic steroid abuse. The study was approved by the Ethics Committee of Recep Tayyip Erdogan University (approval no. 224) and written informed consent was obtained from each participant.
All participants underwent a diagnostic workup with a thorough medical history that included comorbidities, a physical examination, anthropometric measurements, semen analysis, biochemistry assessment, and color Doppler ultrasound of the scrotum. For each participant, weight and height were measured, BMI was calculated, WC was measured, and bioelectrical impedance analysis (BIA) was performed using the Tanita BC-420MA (Tanita UK Ltd.). The physical examinations included a physical assessment for varicocele. Testis and epididymis size was measured by color Doppler ultrasound, and the volume of each testis was calculated using the following formula: testicular volume=[length (mm)×width (mm)×height (mm)]×0.71/1,000 (mL). Varicocele was identified by physical examination when the maximal venous diameter was >3 mm and increased with the Valsalva maneuver.

2. Assays

Fasting blood samples were drawn from all participants in the morning, between 9:00 AM and 12:00 PM. Serum sex steroidal hormones including testosterone (T), follicle-stimulating hormone (FSH), luteinizing hormone (LH), prolactin, and 17‐β‐estradiol were measured using a chemiluminescent microparticle immunoassay method with an Abbott Architect i2000 autoanalyzer (Abbott). The remaining metabolic parameters, including glucose and lipid metabolism, were measured by automated analyzers. The homoeostasis model assessment was calculated as fasting insulin (μU/mL)×fasting glucose (mmol/L)/22.5.

3. Semen analysis

Semen analysis was performed by two experienced biologists in the laboratory of the Andrology Unit. Semen samples were analyzed for semen volume, sperm concentration, sperm motility and morphology, seminal pH, and liquefaction time and were assessed according to the 5th edition of the World Health Organization (WHO) manual for human semen analysis. After 3 days of sexual abstinence, semen samples were collected by masturbation in a sterile container and were incubated at 37 °C during liquefaction. Subsequently, semen volume was estimated from the weight of the semen, assuming a sperm density of 1 g/mL, and was calculated by the gravimetric method. A Neubauer Improved hemocytometer (Shanghai Qijing Biochemical Instrument Co., Ltd.) was used to count the number of sperm (106/mL), and the total sperm count was calculated. Progressive motility was measured (WHO grades A+B) and morphology was assessed according to the Kruger strict criteria.

4. Statistics

1) Preprocessing the dataset

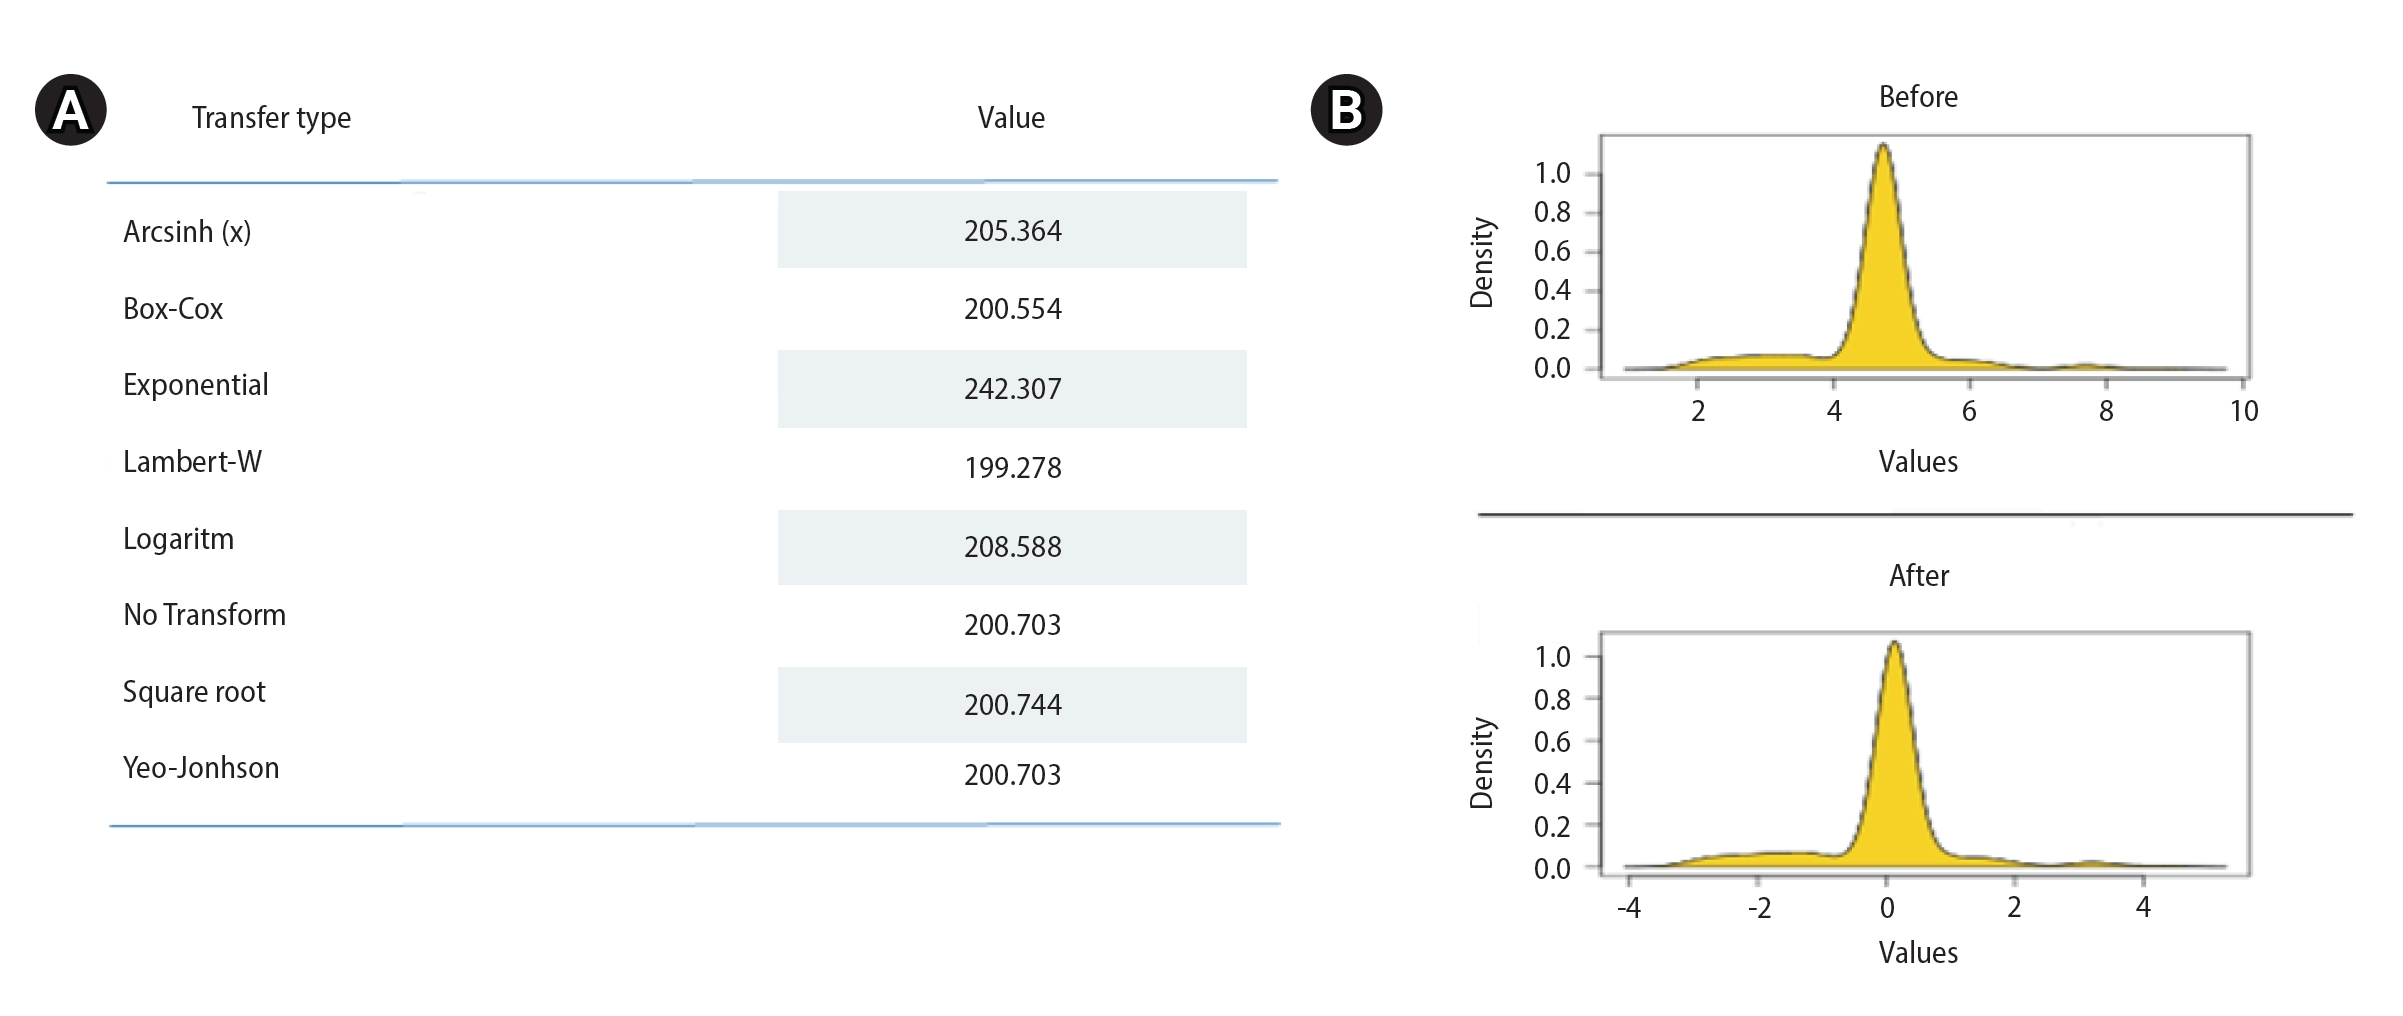
The R programming language (R Foundation for Statistical Computing) and SPSS version 23.0 (IBM Corp.) were used for statistical analysis. All quantitative data were summarized as minimum/maximum or arithmetic mean and standard deviation. While seminal and hormonal parameters were dependent variables in the model, metabolic and anthropometric variables were independent variables. Metabolic and anthropometric variables were used to predict the hormone concentrations and testicular volume by separately measuring the right testis and the left testis. Variations in the dependent variables were explained by the independent variables as estimated by multivariate linear regression analysis. There were no outliers in the data set. However, multiple normal distributions were not met with the Anderson-Darling test (Figure 1). Although data for the variables disrupting the multiple normality were transformed, the multiple normality assumption still could not be achieved (Figure 2).

2) Multilayer perceptron model

The multilayer perceptron (MLP) model, which is the most widely used artificial neural network model and does not require normality assumptions, has been deemed appropriate for use in statistical predictions [15]. The MLP is a feedforward model that maps input datasets to an appropriate output set by adjusting the weights between internal data nodes. Since multiple normality assumptions were not met, we used a correlation matrix to select the variables to be used in the MLP model. For the correlation matrix, Spearman rank correlations were examined between the seminal and metabolic variables, and between the hormonal and metabolic parameters. Independent variables with the highest correlations to the dependent variables were included and analyzed in the MLP model.
The data set was divided into two divisions, training (80%) and testing (20%), and the sum of the squares error (SSE) and relative error (RE) values were checked to assess model performance. In addition, the variables that influenced the seminal or hormonal parameters were determined by their importance and relative importance values (relative importance >50%). The extent to which the independent variables could explain the change in dependent variables was evaluated by the lowest SSE and RE metrics.

3) Power analyses

A sample size calculation (power analysis) was conducted. If there are six or more independent variables in an estimation model with dependent and independent variables, the minimum sample size is obtained with the formula n=104+k (k=number of independent variables). In this study, because the sample size required for each group was 120 (5×24) or 5 times the number of variables, and was still 130 (104+24) when the number of variables was 6 or more, the sample size was considered sufficient.

Results

Of the 304 cohort members invited to participate in the study, 121 (39.8%) men provided a semen sample and underwent all analyses including a physical examination, biochemistry assessment, and testicular ultrasound. All participants had college degrees and similar socio-economic status (data not shown). The mean age of the participants was 27.9 years (range, 22 to 32), none were married, and 69 (57%) and 19 (15.7%) were smokers and consumers of mild alcohol, respectively. No participants had cardiovascular, metabolic, congenital, or chronic diseases. Varicocele (grade 2+3) was detected by physical and ultrasound examinations in the left testicle of 23 men (19%), and subclinical varicocele was observed in 10 (8.2%) and six (4.9%) men in the left and right testicles, respectively. Semen analysis revealed normospermia in 101 (83.5%) participants. Azoospermia was not detected. Metabolic syndrome was observed in three participants (2.5%) based on the National Cholesterol Education Program-Adult Treatment Panel III definition (2001). The characteristics of the participants are presented in Table 1.
Changes in the seminal and hormonal parameters (dependent variables) explained by the metabolic or anthropometric parameters (independent variables) are shown in Table 2 and 3, respectively. The highest percentage of explanation performance for seminal parameters in the training data set was found for liquefaction time (SSE=35.04, RE=0.694), and in the testing data set for sperm count (SSE=3.831) and liquefaction time (RE=0.692) (Table 2). However, the highest explanatory performance for hormonal and testicular parameters was found for LH (SSE=30.12, RE=0.76), and right testis volume (SSE=5.61) and testosterone (RE=0.76) in the training and testing data sets, respectively (Table 3).

Discussion

The associations observed in this study showed that WC may be a more useful measure for male infertility than BMI. Although BMI was associated with total sperm count, WC was additionally predictive of sperm concentration and morphology. However, basal metabolic rate (BMR) was observed as the only predictive anthropometric parameter for seminal pH, liquefaction time, and sperm motility. In terms of metabolic parameters, the measures of glucose metabolism were associated with a greater number of seminal parameters than cholesterol metabolism.
BMI has been identified as a risk factor for male infertility in several studies. However, conflicting results have been reported for numerous methodological reasons [16]. In addition, WC has been associated with a decline in semen volume [17-19], sperm concentration [19,20], total sperm count [17,18,21], sperm morphology [20], and sperm motility [14,18,19]. The studies were largely performed in infertile men whose testicular function was already impaired [17], and differences in the studies can be explained by variance in the study group proportions [17]. In addition to its associations with seminal parameters, WC was also a negative predictor of FSH, the most prominent hormone in spermatogenesis. In this study, BIA measurements were extensively studied for seminal and hormonal parameters. BIA is widely used for estimating body composition [22] and is a more accurate measure of adiposity than BMI. Adiposity is strongly associated with obesity-related health problems [23]. The BMR or daily minimum level of energy utilized by a body in a physical and psychological resting state [24], was found to be the only BIA measurement predictive of seminal pH, liquefaction time, and sperm motility. Although BMR may be an indirect indicator of energy expended during sperm motility, in this study a positive prediction was observed between testicular volume and testosterone. Androgen deficiency was associated with changes in whole-body metabolism including decreased rates of body protein turnover and decreased resting energy expenditure [25]. BMR decreases by 1% to 2% every 10 years, and testosterone levels fall at an average of 1.6% per year [26,27]. Like testosterone, BMR is related to the metabolic rate of tissues [25-27] and could be used as an indicator in the clinical evaluation of patients with hypogonadism. Further studies of this relationship are needed.
Cholesterol is the precursor of sex steroidal hormones; however, little is known about the relationship of cholesterol and lipid metabolism with seminal parameters. In this study, both cholesterol and glucose metabolism were found to explain the variance in seminal parameters. Preclinical models confirm our findings that a high-fat diet may result in decreased sperm motility, sperm count, and morphology, and in increased sperm cholesterol content [28,29]. In this study, WC, fat mass percentage and triglyceride level were negatively predictive of sex hormone binding globulin (SHBG). Lower levels of SHBG have been linked to obesity [30]. Obesity has been shown to affect the gonadotropin-releasing hormone-LH/FSH pulse, which may deteriorate testicular steroidogenesis and spermatogenesis [31]. Metformin, an oral insulin-sensitizing agent that improves insulin sensitivity, has been used in human and animal models and resulted in improvements in seminal parameters [32] and in obesity-induced poor spermatogenesis [33]. Insulin resistance and dyslipidemia are associated with oxidative stress [34], and increased levels of reactive oxygen species impair germ cell production and sperm motility and give rise to sperm DNA damage [35]. Apart from our findings on lipid and glucose metabolism, we found that serum levels of C-reactive protein negatively predicted sperm concentration and total sperm count. Chronic inflammation disrupts the hypothalamic–pituitary-testicular axis and may result in poor semen quality [36].
This study had limitations. Because the cohort included unmarried healthy young men without chronic and genetic diseases, selection bias was possible. Therefore, it is difficult to generalize the results to other male populations (e.g., men with infertility or advanced age). Although the cohort was recruited from a single academic outpatient clinic, the subjects participating in this study came from multiple parts of the country, and thus can be considered to represent the whole country. Only one semen sample was obtained per subject; nevertheless, it has been reported that one sample is adequate to evaluate semen quality in epidemiological studies [37]. Differences in the predictive variables between right and left testis volume may be due to volume differences, the fact that varicocele was more common on the left side, or by chance. Finally, the cross-sectional design does not permit inference of a causal relationship between metabolic and seminal parameters.
In conclusion, this study demonstrated that anthropometric and metabolic parameters have predictive relationships with seminal parameters and sex steroidal hormones. These findings add further insight into the underlying mechanisms of these relationships, which can be used to develop preventive and therapeutic interventions that improve semen quality in the management of infertile men.

Notes

Conflict of interest

No potential conflict of interest relevant to this article was reported.

Author contributions

Conceptualization: HU, MH. Data curation: HU, MH, EZ, YÖO, BS, GA. Formal analysis: HU, MK. Methodology: HU, MH, EZ, YÖO, BS, GA. Writing-original draft: HU. Writing-review & editing: HU.

Figure 1.
(A, B) Multiple normal distributions.
cerm-2023-06114f1.jpg
Figure 2.
(A, B) Transformation operation.
cerm-2023-06114f2.jpg
Table 1.
The variables used to evaluate the relationship of anthropometric and metabolic risk factors with testicular function
Variable Mean±SD Range (minimum- maximum)
Semen parameters
 Semen volume (mL) 4.45±0.92 1.97–8.98
 Sperm concentration (million/mL) 62.9±23.6 0.1–200
 Total sperm count (million/mL) 275±1,132 0.824–98.7
 Motility 49.3±8.4 0–86
 Morphology 9.8±3.3 0–20
 Semen pH 7.96±0.25 7.2–9.0
 Liquefaction (min) 25.4±9.13 5–60
Anthropometric parameters
 Height (cm) 176.3±2.65 167–188
 Weight (kg) 73.9±4.14 56.8–92.7
 Waist circumference (cm) 87.7±3.54 69–103
 BMI (kg/m2) 23.4±1.3 18.2–27.4
Tanita measurements
 Fat mass percentage (%) 9.07±1.85 3–16.9
 Fat mass (kg) 6.68±1.66 1.7–13.8
 Total body water (%) 46.2±2.2 37.4–60.1
 Bone mass (kg) 3.31±0.13 2.8–4
 Basal metabolic rate (kJ) 8,162.8±536.5 711–10,134
 Metabolic age (yr) 12.23±1.03 12–22
Metabolic parameters
 Glucose (mg/dL) 88.7±4.12 66–109
 TSH (µIU/mL) 1.39±0.54 0.16–7.01
 Creatinine (mg/dL) 0.83±0.037 0.66–1.11
 Total cholesterol (mg/dL) 159.1±18.4 74–328
 Triglycerides (mg/dL) 84.2±26.03 24 -301
 HDL-C (mg/dL) 45.2±5.29 22.8–76.1
 LDL-C (mg/dL) 93.36±16.48 21–260
 Insulin (µU/mL) 5.39±1.67 1.2–22.1
 HOMA-IR 1.19±0.32 0.42–4.25
 GGT (U/L) 17. 62±4.27 6–60
 CRP (mg/L) 0.13±0.16 0.1–1.8
 Hemoglobin (g/dL) 14.94±1.01 12.3–17.2
 Folate (ng/mL) 5.59±0.85 1.5–11.8
 RDW-CV (%) 13.25 11.9–18.3
Hormonal parameters
 FSH (mU/mL) 2.69±0.87 0.87–8.68
 LH (mU/mL) 3.06±0.67 1.35–7.43
 Testosterone (ng/dL) 548.92±104.01 196–1,089
 Estradiol (pg/mL) 26.6±5 10–49
 SHBG (µg/dL) 2641.2±736.8 1,084–8,693
 DHEA-S (nmol/L) 320±51.2 109–560
 Prolactin (µg/L) 6.6±2.8 3.3–45
Testicular volume parameters
 Right testis volume (mL) 20.4±3.3 13.6–39.3
 Left testis volume (mL) 19.8±3.2 7.7–45.1

SD, standard deviation; BMI, body mass index; kJ, kilojoule; TSH, thyroid-stimulating hormone; HDL-C, high density lipoprotein cholesterol; LDL-C, low density lipoprotein cholesterol; HOMA-IR, homoeostasis model assessment of insulin resistance; GGT, gamma glutamine transaminase; CRP, C-reactive protein; RDW-CV, red blood cell distribution width-coefficient of variation; FSH, follicle-stimulating hormone; LH, luteinizing hormone; SHBG, sex hormone binding globulin; DHEA-S, dehydroepiandrosterone sulfate.

Table 2.
The perceptron model of the relationships between semen parameters and metabolic variables
Parameter Semen volume Sperm concentration Total sperm count Motility Morphology Semen pH Liquefaction time
SSE RE SSE RE SSE RE SSE RE SSE RE SSE RE SSE RE
Training (80%) 48.88 1.07 53.52 1.08 47.520 0.941 47.030 0.990 41.11 0.894 41.46 0.99 35.04 0.69
Testing (20%) 15.09 1.00 3.83 0.93 5.903 0.895 6.290 0.866 15.940 0.791 15.09 0.97 6.21 0.69
Metabolic variable a) b) a) b) a) b) a) b) a) b) a) b) a) b)
 Anthropometric
  Height 0.05 44.90 0.03 31.90 0.007 7.2 0.041 38.7 0.024 32.5 0.04 30.60 0.03 27.10
  Weight 0.03 29.60 0.03 31.10 0.042 44.5 0.011 10.8 0.051 69 0.03 23.50 0.03 26.00
  WC 0.03 24.80 0.08 79.90 0.052 54.2 0.045 41.7 0.049 67.3 0.04 35.00 0.01 5.70
  BMI 0.00 2.50 0.03 27.70 0.064 67 0.012 11.4 0.021 29.2 0.03 29.70 0.02 17.10
 Tanita
  Fat mass percentage 0.02 13.10 0.00 4.10 0.017 18.2 0.042 39.6 0.022 29.9 0.02 14.00 0.05 38.10
  Fat mass 0.01 11.00 0.05 48.20 0.032 33.1 0.013 11.8 0.025 34.5 0.03 29.60 0.05 38.00
  TBW 0.12 100.0 0.10 100.00 0.050 52.3 0.018 16.7 0.022 29.4 0.03 22.60 0.02 14.90
  BM 0.02 15.20 0.07 68.70 0.029 29.9 0.015 14.5 0.040 54 0.03 26.20 0.03 23.90
  BMR 0.08 67.40 0.03 29.90 0.030 31.9 0.076 71.2 0.033 45.5 0.07 60.10 0.12 100.00
  Metabolic age 0.04 30.70 0.04 46.50 0.040 42.3 0.026 24.5 0.071 96.3 0.02 18.80 0.02 18.20
 Biochemistry
  Glucose 0.08 67.10 0.01 8.70 0.025 26 0.087 81.2 0.033 44.6 0.02 20.60 0.05 39.60
  TSH 0.00 1.60 0.04 39.50 0.047 49.1 0.064 60.4 0.030 40.5 0.05 46.90 0.01 6.90
  Creatinine 0.10 84.20 0.01 5.90 0.081 84.7 0.024 22.2 0.062 84.7 0.01 4.60 0.05 41.20
  TC 0.06 52.70 0.03 34.00 0.053 55.9 0.044 41 0.045 61.7 0.07 57.10 0.04 36.20
  TG 0.05 40.90 0.05 47.70 0.043 44.9 0.018 17.3 0.025 34.7 0.06 49.10 0.04 34.30
  HDL-C 0.02 15.80 0.03 27.30 0.025 26.5 0.014 12.7 0.026 35.8 0.04 37.90 0.01 10.40
  LDL-C 0.00 3.60 0.04 39.20 0.004 3.8 0.016 15.1 0.039 53.3 0.09 74.50 0.04 35.10
  Insulin 0.04 31.40 0.06 65.50 0.043 45.1 0.082 76.5 0.068 92.2 0.06 52.10 0.08 62.90
  HOMA-IR 0.00 2.40 0.04 44.50 0.095 100 0.083 78.2 0.073 100 0.04 34.70 0.04 33.30
  GGT 0.09 77.20 0.05 48.40 0.055 57.5 0.032 30 0.045 60.9 0.04 32.80 0.03 26.40
  CRP 0.07 56.70 0.06 63.90 0.053 55.7 0.028 26.1 0.054 73.5 0.03 23.10 0.02 12.50
  Hemoglobin 0.04 37.60 0.06 59.50 0.042 44.1 0.072 67.8 0.060 81.4 0.12 100.00 0.05 40.10
  Folate 0.03 29.40 0.03 35.40 0.031 32.6 0.107 100 0.070 94.9 0.03 22.90 0.05 40.80
  RDW-CV 0.01 11.40 0.06 63.80 0.039 41.4 0.030 28.3 0.012 16.7 0.01 10.80 0.11 91.60

SSE, sum of squares error; RE, relative error; WC, waist circumference; BMI, body mass index; TBW, total body water; BM, bone mass; BMR, basal metabolic rate; TSH, thyroid-stimulating hormone; TC, total cholesterol; TG, triglyceride; HDL-C, high density lipoprotein cholesterol; LDL-C, low density lipoprotein cholesterol; HOMA-IR, homoeostasis model assessment of insulin resistance; GGT, gamma glutamine transaminase; CRP, C-reactive protein; RDW-CV, red blood cell distribution width.

a)Importance; b)Relative importance (%).

Table 3.
The perceptron model of the relationships between hormonal parameters and metabolic variables
Parameter FSH LH Testosterone Estradiol SHBG DHEA-S PRL Right testis volume Left testis volume
SSE RE SSE RE SSE RE SSE RE SSE RE SSE RE SSE RE SSE RE SSE RE
Training (80%) 37.20 0.83 30.12 0.76 36.15 0.80 40.47 0.92 30.32 0.81 38.07 1.00 38.11 0.87 43.99 0.99 44.42 1.01
Testing (20%) 12.81 0.97 20.64 0.85 7.35 0.76 14.99 0.81 25.07 0.87 22.88 0.99 8.82 0.87 5.61 1.02 22.68 1.04
Metabolic variable a) b) a) b) a) b) a) b) a) b) a) b) a) b) a) b) a) b)
 Anthropometric
  Height 0.024 23.900 0.028 25.400 0.048 27.100 0.013 11.200 0.042 33.100 0.032 29.300 0.029 21.900 0.033 33.900 0.010 12.400
  Weight 0.031 30.900 0.042 38.700 0.011 26.000 0.011 9.700 0.002 1.400 0.04 36.500 0.030 22.800 0.069 71.800 0.061 78.200
  WC 0.057 57.000 0.016 15.100 0.030 5.700 0.086 74.600 0.066 52.300 0.037 34.200 0.076 57.100 0.061 63.700 0.049 63.600
  BMI 0.024 23.500 0.021 19.300 0.011 17.100 0.018 15.800 0.017 13.300 0.023 20.800 0.017 12.800 0.029 30.000 0.001 1.500
 Tanita
  Fat mass percentage 0.027 26.700 0.074 68.00 0.038 38.100 0.022 19.600 0.085 67.100 0.031 28.800 0.080 60.100 0.026 27.400 0.029 37.700
  Fat mass 0.034 33.500 0.105 97.200 0.071 38.000 0.075 65.300 0.006 5.000 0.006 5.900 0.023 17.200 0.042 44.000 0.030 38.500
  TBW 0.016 16.200 0.004 3.500 0.041 14.900 0.041 36.000 0.058 45.400 0.042 38.300 0.026 19.800 0.036 37.300 0.057 73.700
  BM 0.036 35.600 0.007 6.100 0.014 23.900 0.019 16.600 0.109 85.900 0.109 100.000 0.041 31.300 0.004 4.100 0.005 6.400
  BMR 0.070 69.300 0.051 46.800 0.121 100.000 0.032 28.300 0.006 4.800 0.039 35.600 0.043 32.300 0.062 64.500 0.069 88.400
  Metabolic age 0.038 38.000 0.033 30.700 0.029 18.200 0.049 42.800 0.033 26.300 0.053 48.200 0.036 26.900 0.049 51.300 0.019 24.100
 Biochemistry
  Glucose 0.013 13.000 0.050 46.5000 0.040 39.600 0.028 24.200 0.036 28.400 0.038 34.800 0.080 60.500 0.006 6.700 0.066 84.600
  TSH 0.033 32.500 0.005 4.500 0.074 6.900 0.003 2.700 0.011 8.600 0.035 32.300 0.085 63.800 0.045 47.000 0.054 69.100
  Creatinine 0.038 38.200 0.108 100.000 0.044 41.200 0.026 22.900 0.011 8.800 0.055 50.700 0.004 3.000 0.002 2.400 0.036 45.800
  TC 0.038 38.100 0.048 44.200 0.053 36.200 0.109 95.200 0.050 39.500 0.054 49.800 0.078 58.500 0.046 48.200 0.038 48.700
  TG 0.049 49.200 0.056 51.900 0.050 34.300 0.011 10.000 0.080 63.200 0.006 5.400 0.027 20.100 0.020 20.500 0.005 5.800
  HDL-C 0.030 29.700 0.035 32.100 0.024 10.400 0.081 70.800 0.009 7.200 0.009 8.700 0.044 33.300 0.045 46.600 0.062 79.700
  LDL-C 0.035 34.500 0.063 58.500 0.026 35.100 0.023 20.300 0.036 28.600 0.056 51.000 0.009 6.600 0.074 77.000 0.071 91.000
  Insulin 0.040 39.700 0.050 46.200 0.087 62.900 0.019 16.400 0.042 32.700 0.030 27.100 0.026 19.400 0.033 34.500 0.028 35.600
  HOMA-IR 0.088 87.400 0.062 57.300 0.009 33.300 0.016 13.800 0.033 25.800 0.069 62.900 0.011 8.500 0.061 62.900 0.050 64.600
  GGT 0.100 100.000 0.050 46.400 0.033 26.400 0.090 78.700 0.042 32.800 0.097 89.000 0.046 35.000 0.074 77.100 0.059 75.800
  CRP 0.015 14.500 0.029 26.500 0.007 12.500 0.057 49.400 0.076 60.200 0.003 2.800 0.005 3.600 0.052 53.800 0.033 42.400
  Hemoglobin 0.087 86.500 0.044 40.700 0.160 40.100 0.115 100.000 0.127 100.000 0.006 5.300 0.042 31.500 0.096 100.000 0.078 100.000
  Folate 0.043 43.300 0.015 13.700 0.063 40.800 0.019 17.000 0.016 12.300 0.098 90.000 0.011 8.500 0.004 4.600 0.060 76.900
  RDW-CV 0.035 35.200 0.004 3.500 0.103 91.600 0.035 30.500 0.006 4.500 0.031 28.100 0.133 100.000 0.026 27.400 0.033 42.300

FSH, follicle-stimulating hormone; LH, luteinizing hormone; SSE, sum of squares error; SHBG, sex hormone binding globulin; DHEA-S, dehydroepiandrosterone sulfate; PRL, prolactin; SSE, sum of squares error; RE, relative error; WC, waist circumference; BMI, body mass index; TBW, total body water; BM, bone mass; BMR, basal metabolic rate; TSH, thyroid-stimulating hormone; TC, total cholesterol; TG, triglyceride; HDL-C, high density lipoprotein cholesterol; LDL-C, low density lipoprotein cholesterol; HOMA-IR, homoeostasis model assessment of insulin resistance; GGT, gamma glutamine transaminase; CRP, C-reactive protein; RDW-CV, red blood cell distribution width.

a)Importance; b)Relative importance (%).

References

1. Levine H, Jorgensen N, Martino-Andrade A, Mendiola J, Weksler-Derri D, Mindlis I, et al. Temporal trends in sperm count: a systematic review and meta-regression analysis. Hum Reprod Update 2017;23:646-59.
crossref pmid pmc
2. Li CJ, Tzeng CR, Chen RY, Han BC, Yeh CY, Chien LC. Decline in semen quality in men in northern Taiwan between 2001 and 2010. Chin J Physiol 2016;59:355-65.
crossref pmid
3. Sengupta P, Nwagha U, Dutta S, Krajewska-Kulak E, Izuka E. Evidence for decreasing sperm count in African population from 1965 to 2015. Afr Health Sci 2017;17:418-27.
crossref pmid pmc
4. Sengupta P, Borges E Jr, Dutta S, Krajewska-Kulak E. Decline in sperm count in European men during the past 50 years. Hum Exp Toxicol 2018;37:247-55.
crossref pmid pdf
5. Skakkebaek NE, Rajpert-De Meyts E, Buck Louis GM, Toppari J, Andersson AM, Eisenberg ML, et al. Male reproductive disorders and fertility trends: influences of environment and genetic susceptibility. Physiol Rev 2016;96:55-97.
crossref pmid pmc
6. Eisenberg ML, Li S, Cullen MR, Baker LC. Increased risk of incident chronic medical conditions in infertile men: analysis of United States claims data. Fertil Steril 2016;105:629-36.
crossref pmid
7. Latif T, Kold Jensen T, Mehlsen J, Holmboe SA, Brinth L, Pors K, et al. Semen quality as a predictor of subsequent morbidity: a Danish cohort study of 4,712 men with long-term follow-up. Am J Epidemiol 2017;186:910-7.
crossref pmid
8. Eisenberg ML, Li S, Behr B, Cullen MR, Galusha D, Lamb DJ, et al. Semen quality, infertility and mortality in the USA. Hum Reprod 2014;29:1567-74.
crossref pmid pmc
9. Jensen TK, Jacobsen R, Christensen K, Nielsen NC, Bostofte E. Good semen quality and life expectancy: a cohort study of 43,277 men. Am J Epidemiol 2009;170:559-65.
crossref pmid
10. Walsh TJ, Schembri M, Turek PJ, Chan JM, Carroll PR, Smith JF, et al. Increased risk of high-grade prostate cancer among infertile men. Cancer 2010;116:2140-7.
crossref pmid pmc
11. Hart RJ, Doherty DA, Mori TA, Adams LA, Huang RC, Minaee N, et al. Features of the metabolic syndrome in late adolescence are associated with impaired testicular function at 20 years of age. Hum Reprod 2019;34:389-402.
crossref pmid
12. Alberti KG, Zimmet P, Shaw J. Metabolic syndrome: a new world-wide definition: a consensus statement from the International Diabetes Federation. Diabet Med 2006;23:469-80.
crossref pmid
13. Ferlin A, Garolla A, Ghezzi M, Selice R, Palego P, Caretta N, et al. Sperm count and hypogonadism as markers of general male health. Eur Urol Focus 2021;7:205-13.
crossref pmid
14. Ventimiglia E, Capogrosso P, Colicchia M, Boeri L, Serino A, Castagna G, et al. Metabolic syndrome in white European men presenting for primary couple’s infertility: investigation of the clinical and reproductive burden. Andrology 2016;4:944-51.
crossref pmid
15. Rosenblatt F. Two theorems of statistical separability in the perceptron. United States Department of Commerce, Office of Technical Services; 1958.

16. Ma J, Wu L, Zhou Y, Zhang H, Xiong C, Peng Z, et al. Association between BMI and semen quality: an observational study of 3966 sperm donors. Hum Reprod 2019;34:155-62.
crossref pmid pmc
17. Eisenberg ML, Kim S, Chen Z, Sundaram R, Schisterman EF, Louis GM. The relationship between male BMI and waist circumference on semen quality: data from the LIFE study. Hum Reprod 2015;30:493-4.
crossref pmid pmc
18. Fejes I, Koloszar S, Szollosi J, Zavaczki Z, Pal A. Is semen quality affected by male body fat distribution? Andrologia 2005;37:155-9.
crossref pmid
19. Hammiche F, Laven JS, Twigt JM, Boellaard WP, Steegers EA, Steegers-Theunissen RP. Body mass index and central adiposity are associated with sperm quality in men of subfertile couples. Hum Reprod 2012;27:2365-72.
crossref pmid
20. Tsao CW, Liu CY, Chou YC, Cha TL, Chen SC, Hsu CY. Exploration of the association between obesity and semen quality in a 7630 male population. PLoS One 2015;10:e0119458.
crossref pmid pmc
21. Ehala-Aleksejev K, Punab M. The different surrogate measures of adiposity in relation to semen quality and serum reproductive hormone levels among Estonian fertile men. Andrology 2015;3:225-34.
crossref pmid
22. Wan CS, Ward LC, Halim J, Gow ML, Ho M, Briody JN, et al. Bioelectrical impedance analysis to estimate body composition, and change in adiposity, in overweight and obese adolescents: comparison with dual-energy X-ray absorptiometry. BMC Pediatr 2014;14:249.
crossref pmid pmc pdf
23. Yusuf S, Hawken S, Ounpuu S, Bautista L, Franzosi MG, Commerford P, et al. Obesity and the risk of myocardial infarction in 27,000 participants from 52 countries: a case-control study. Lancet 2005;366:1640-9.
crossref pmid
24. Gundmi S, Maiya AG, Bhat AK, Hande MH, Kumar AS. Screening for basal metabolic rate and visceral fat among postmenopausal osteoporosis with type 2 diabetes mellitus. Diabetes Metab Syndr 2019;13:981-4.
crossref pmid
25. Mauras N, Hayes V, Welch S, Rini A, Helgeson K, Dokler M, et al. Testosterone deficiency in young men: marked alterations in whole body protein kinetics, strength, and adiposity. J Clin Endocrinol Metab 1998;83:1886-92.
crossref pmid
26. Vasquez-Alvarez S, Bustamante-Villagomez SK, Vazquez-Marroquin G, Porchia LM, Perez-Fuentes R, Torres-Rasgado E, et al. Metabolic age, an index based on basal metabolic rate, can predict individuals that are high risk of developing metabolic syndrome. High Blood Press Cardiovasc Prev 2021;28:263-70.
crossref pmid pdf
27. Manini TM. Energy expenditure and aging. Ageing Res Rev 2010;9:1-11.
crossref pmid pmc
28. Palmer NO, Bakos HW, Fullston T, Lane M. Impact of obesity on male fertility, sperm function and molecular composition. Spermatogenesis 2012;2:253-63.
crossref pmid pmc
29. Marchiani S, Vignozzi L, Filippi S, Gurrieri B, Comeglio P, Morelli A, et al. Metabolic syndrome-associated sperm alterations in an experimental rabbit model: relation with metabolic profile, testis and epididymis gene expression and effect of tamoxifen treatment. Mol Cell Endocrinol 2015;401:12-24.
crossref pmid
30. Goldstajn MS, Toljan K, Grgic F, Jurkovic I, Baldani DP. Sex hormone binding globulin (SHBG) as a marker of clinical disorders. Coll Antropol 2016;40:211-8.
pmid
31. Hammoud AO, Gibson M, Peterson CM, Meikle AW, Carrell DT. Impact of male obesity on infertility: a critical review of the current literature. Fertil Steril 2008;90:897-904.
crossref pmid
32. Morgante G, Tosti C, Orvieto R, Musacchio MC, Piomboni P, De Leo V. Metformin improves semen characteristics of oligo-terato-asthenozoospermic men with metabolic syndrome. Fertil Steril 2011;95:2150-2.
crossref pmid
33. Liu CY, Chang TC, Lin SH, Wu ST, Cha TL, Tsao CW. Metformin ameliorates testicular function and spermatogenesis in male mice with high-fat and high-cholesterol diet-induced obesity. Nutrients 2020;12:1932.
crossref pmid pmc
34. Dandona P, Aljada A, Chaudhuri A, Mohanty P, Garg R. Metabolic syndrome: a comprehensive perspective based on interactions between obesity, diabetes, and inflammation. Circulation 2005;111:1448-54.
crossref pmid
35. Bakos HW, Mitchell M, Setchell BP, Lane M. The effect of paternal diet-induced obesity on sperm function and fertilization in a mouse model. Int J Androl 2011;34(5 Pt 1): 402-10.
crossref pmid
36. Leisegang K, Bouic PJ, Henkel RR. Metabolic syndrome is associated with increased seminal inflammatory cytokines and reproductive dysfunction in a case-controlled male cohort. Am J Reprod Immunol 2016;76:155-63.
crossref pmid
37. Stokes-Riner A, Thurston SW, Brazil C, Guzick D, Liu F, Overstreet JW, et al. One semen sample or 2?: insights from a study of fertile men. J Androl 2007;28:638-43.
crossref pmid


ABOUT
ARTICLE CATEGORY

Browse all articles >

BROWSE ARTICLES
AUTHOR INFORMATION
Editorial Office
Department of Obstetrics and Gynecology, Seoul National University Bundang Hospital
82 Gumi-ro 173, Bundang-gu, Seongnam 13620, Korea
Tel: +82-31-787-7254    CP: +82-10-9072-3154    E-mail: blasto@snubh.org                

Copyright © 2024 by Korean Society for Reproductive Medicine.

Developed in M2PI

Close layer
prev next