


Introduction
Serum anti-M├╝llerian hormone (AMH) is a valuable clinical marker of ovarian reserve and is routinely measured in women receiving infertility treatment. In addition, it is commonly assessed in various areas of womenŌĆÖs health and fertility care [1].
To demonstrate the value of serum AMH as an ovarian reserve marker in clinical and research settings, a highly reliable commercial assay is essential [2]. Various AMH immunoassays have been developed and revised, of which the revised Gen II (rev-Gen II) version predominated until recently. However, a fully automated AMH assay was introduced in 2014 and is now the major assay for serum AMH. With the automated AMH assay, several technical problems associated with rev-Gen II (low accuracy, inter-laboratory variation, and relatively long measurement time) have been largely resolved [3].
One concern is whether the AMH values measured by automated assay are interchangeable with those measured by rev-Gen II. Although the manufacturer guidelines indicate that this is true for AMH measurements obtained by the Access automated assay (Beckman-Coulter), the potential for discordance between the two methods requires investigation [4].
In immunoassays conducted on patient serum samples, both pre-analytical and analytical variation, as well as intra-individual biological variation, should be considered [5]. To improve the automated AMH assay, several types of variation should be minimized [6].
In the original Gen II assay, factors influencing the pre-analytical variation included blood sample handling, serum separation time, storage conditions, and sample freezing, all of which can produce fluctuations in AMH values. Thus, both pre-analytical variation and reproducibility should be investigated for the automated AMH assay [6].
Few studies have been conducted on the pre-analytical variation associated with the automated AMH assay, which should prove to be reproducible irrespective of storage conditions [7]. In particular, further investigation is required regarding whether long-term serum storage could affect the AMH measurements obtained by automated assay. In clinical settings, AMH values are often measured after long-term storage of serum. In fact, published large-scale AMH data commonly include measurements taken under varying storage conditions or with varying freezing times, up to several years; this hampers the stability and validity of the AMH results [8]. Concern about the long-term stability of serum AMH measurement remains unresolved. However, a few studies have indicated that the long-term storage of serum samples at ŌĆō20, ŌĆō, and 80 Ōäā has little impact on serum AMH levels [7,9].
The rev-Gen II assay reportedly exhibits good stability and reliability of AMH values in serum, but studies of its stability in whole blood are scarce [10]. In real clinical situations, some delay between blood collection and serum separation commonly occurs. Few studies have been conducted on the reliability and reproducibility of the AMH measurements obtained by automated assay (Access) across blood or serum storage conditions. Considering the worldwide use of the automated AMH assay, validation of its reliability and reproducibility under specific pre-analytical conditions is urgently required.
The aims of this study were to investigate the concordance of AMH measurements obtained by rev-Gen II and automated (Access) assays across serum or blood sample storage conditions, as well as to evaluate the reliability and reproducibility of each AMH assay according to serum or blood sample storage conditions.
Methods
1. Participants
A prospective study was conducted, and 74 female volunteers were enrolled between October 2015 and November 2015; all were non-pregnant women aged 25 to 45 years with no relevant comorbidities or medications. Eight women had polycystic ovary syndrome. Written informed consent was obtained from all women. The study was approved by the Hamchoon Institutional Review Board (no. 73507-201507-BR-003).
2. Blood sample preparation and serum AMH measurement
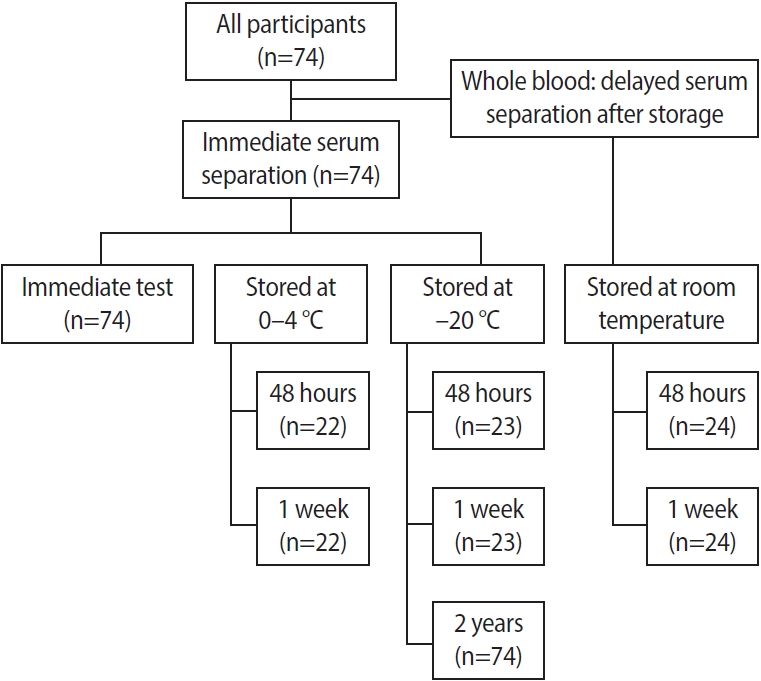
Eight blood sample storage conditions were set according to the timing of AMH measurement and serum separation (Figure 1): (1) Immediate serum separation and immediate AMH measurement (fresh control, n=74); (2) Serum stored at ŌĆō20 Ōäā and AMH measured after 48 hours (n=23), 1 week (n=23), and 2 years (n=74); (3) Serum stored at 0 to 4 Ōäā and AMH measured after 48 hours and 1 week (n=22); (4) Delayed serum separation: blood kept at room temperature and serum separation conducted after 48 hours and 1 week, followed by immediate AMH measurement (n=24).
Peripheral blood samples were collected in serum separator gel tubes (V-Tube; AB Medical) and allowed to clot at room temperature, then centrifuged at 1,000 ├Ś g for 10 minutes within 2 hours of collection to separate the sera. In fresh controls, sera were separated and serum AMH values were measured immediately. The remaining sera were distributed into five Eppendorf tubes and stored at ŌĆō20 Ōäā or 0 to 4 Ōäā.
For delayed serum separation, portions of the blood samples were distributed into two V-Tubes and left at room temperature. After either 48 hours or 1 week, blood samples were centrifuged at 1,000 ├Śg for 10 minutes, and sera were separated. Serum AMH levels were measured immediately.
In all blood/serum samples, AMH values were measured once each by rev-Gen II and automated (Access) assays. All measurement procedures were performed by one experienced technician according to the manufacturerŌĆÖs protocols.
For the rev-Gen II assay, the Gen II kit (A79765; Beckman-Coulter) was used with revised instructions (IFU-REF A92268D). The revised protocol included an additional assay step that involved pre-mixing all of the calibrators, controls, and samples with the Gen II assay buffer before adding the sample to the Gen II microplate. The measurement range was 0.08 to 22.5 ng/mL. AMH values Ōēż0.08 were censored at a value of 0.08 ng/mL. The intra- and inter-assay coefficients of variability (CVs) were 5.4% and 5.6%, respectively.
For the automated assay, an Access 2 Immunoassay System (Beckman-Coulter) was used. The AMH level was determined using a 6-point calibration curve, and calibrators were prepared with recombinant human AMH in a synthetic matrix. The limit of quantitation was 0.08 ng/mL, and the measurement range was 0.02 to 24.0 ng/mL. The total imprecision was a CV Ōēż10.0% at concentrations Ōēź0.16 ng/mL.
3. Statistical analysis
The correlations between the rev-Gen II-AMH and Access-AMH values were assessed using the Pearson correlation test and the paired Wilcoxon signed-rank test. The intraclass correlation coefficient with absolute agreement (ICC-aa) and 95% confidence intervals were calculated based on a single-rating, absolute agreement, two-way random-effects model. For regression equations, the method described by Passing and Bablok was used. For limits of agreement (LOAs) and likelihood of bias analyses, a Bland-Altman plot was created [11].
To analyze the reproducibility of each assay, AMH levels under seven storage conditions were compared with measurements taken in fresh controls using the Pearson correlation test, ICC-aa values, and the paired Wilcoxon signed-rank test.
All statistical analyses were performed using R for Windows version 3.2.0 (R Foundation for Statistical Computing) and STATA 14 (StataCorp LP). A p<0.05 was considered to indicate statistical significance.
Results
1. Comparison between the rev-Gen II-AMH and Access-AMH values
The rev-Gen II-AMH and Access-AMH values displayed strong correlations for all eight blood/serum sample storage conditions (Table 1). The correlation coefficients ranged from 0.977 to 0.995 (p<0.001 for all). ICC-aa values ranged from 0.93 to 0.97, and all showed good concordance.
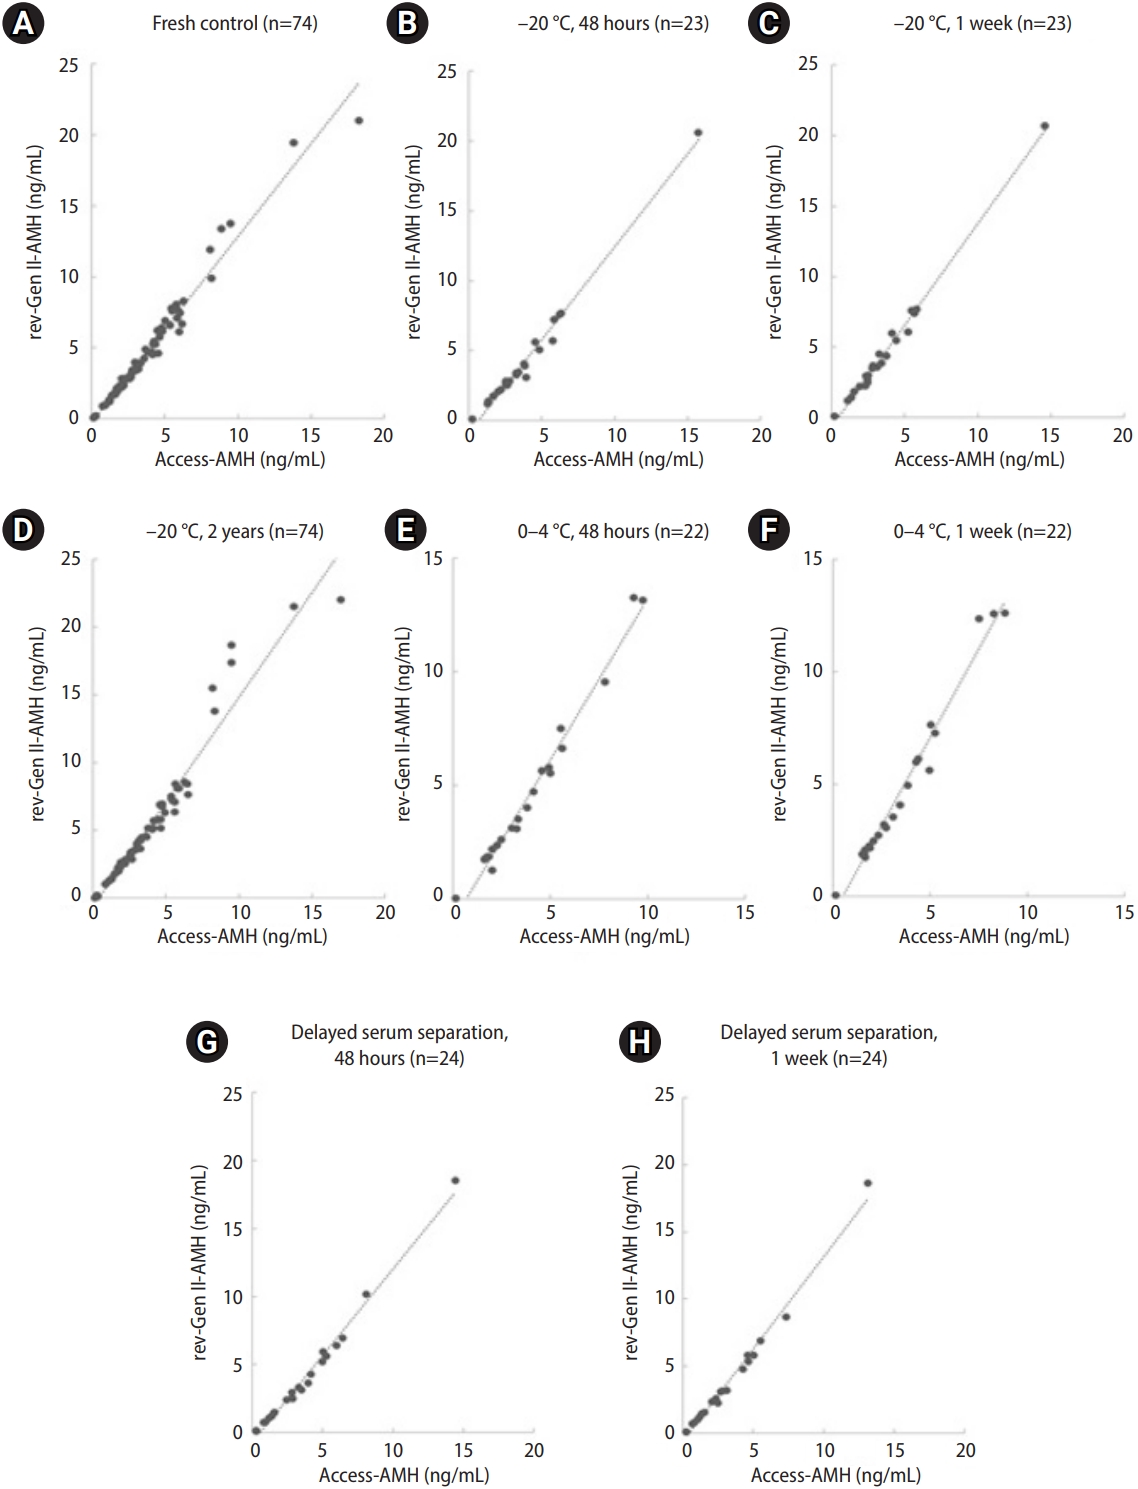
Figure 2 includes scatter plot diagrams with regression lines associated with the eight storage conditions. The regression showed no significant deviation from linearity. The representative regression equation for the fresh control was (Access-AMH)=0.74├Ś(rev-Gen II-AMH)+0.28. For example, a rev-Gen II-AMH measurement of 1.0 ng/mL corresponded to an Access-AMH value of 1.02 ng/mL, and a rev-Gen II-AMH measurement of 2.0 ng/mL corresponded to an Access-AMH value of 1.76 ng/mL.
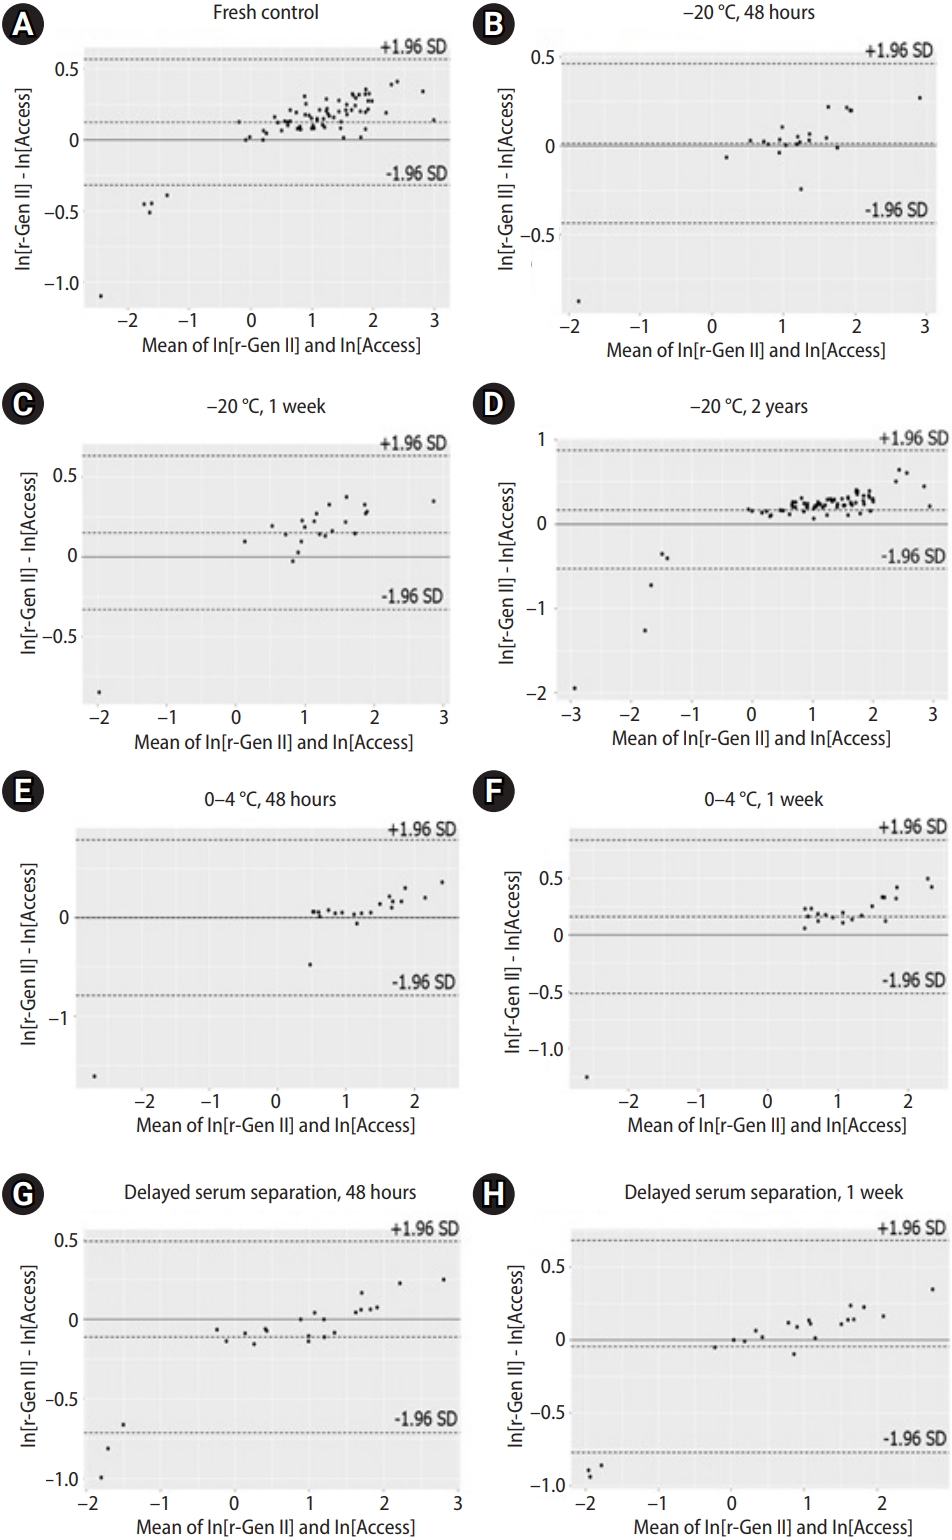
Figure 3 shows the associations between the rev-Gen II-AMH and Access-AMH values based on the Bland-Altman plots. Of the values, 5.4% (4/74) were outside the LOAs, but all fell below the lower limit (Figure 3A). Under the assumption of normal distribution, AMH values were naturally log-transformed, then expressed as ln[rev-Gen II-AMH] and ln[Access-AMH]. Natural logarithmic transformation was successful in producing differences unrelated to the mean.
Table 2 summarizes the mean differences and 95% LOAs between ln[rev-Gen II-AMH] and ln[Access-AMH]. We calculated the anti-logarithms for the differences between ln[rev-Gen II-AMH] and ln[Access-AMH] to obtain values representing the ratios of rev-Gen II-AMH and Access-AMH (ln[rev-Gen II-AMH]ŌĆōln[Access-AMH]=ln[rev-Gen II-AMH/Access-AMH]). We also calculated the anti-logarithms of the 95% LOAs of the differences between ln[rev-Gen II-AMH] and ln[Access-AMH] to obtain 95% LOAs of the ratios of rev-Gen II-AMH and Access-AMH. The geometric mean ratio of rev-Gen II-AMH and Access-AMH values in the fresh control was 1.132 with a 95% LOA of 1.083 to 1.197 (representing the anti-logarithms of the values in Table 2), meaning that the rev-Gen II-AMH exceeded the Access-AMH value by between 8.3% and 19.7% for most measurements.
2. Reproducibility analysis of each assay: comparison of AMH values at seven storage conditions with fresh controls
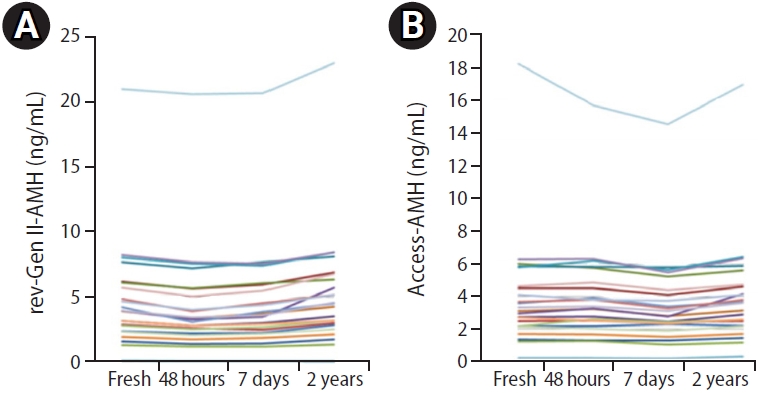
After storage for 48 hours and 1 week at 0 to 4 ┬░C, the rev-Gen II-AMH level had decreased by 12.6%┬▒10.6% (mean┬▒standard deviation) and 6.5%┬▒4.7%, respectively, compared with fresh controls (p<0.001 for all). After storage for 48 hours and 1 week at ŌĆō20 Ōäā, the rev-Gen II-AMH level had decreased by 11.8%┬▒6.3% and 7.6%┬▒7.0%, respectively, compared with fresh controls (p<0.001 for all). On the contrary, sera stored at ŌĆō20 Ōäā for 2 years yielded significantly higher rev-Gen II-AMH values than fresh controls (10.8%┬▒14.0%, p<0.01). The progressive effects of storage-dependent serum AMH values are shown in Figure 4.
The Access-AMH level decreased by 0.2%┬▒4.1% (p=0.554) in sera stored for 48 hours at 0 to 4 Ōäā and 1.3%┬▒7.1% (p=0.424) in sera stored for 48 hours at ŌĆō20 Ōäā, relative to fresh controls. The Access-AMH measurement remained stable in sera stored for up to 48 hours at both 0 to 4 Ōäā and ŌĆō20 Ōäā. The Access-AMH level decreased by 7.7%┬▒4.6% and 7.1%┬▒6.9% in sera stored for 1 week at 0 to 4 Ōäā and ŌĆō20 Ōäā, respectively, compared with fresh controls (p<0.001 for all). On the contrary, sera stored at ŌĆō20 Ōäā for 2 years yielded significantly higher Access-AMH values compared with fresh controls (4.5%┬▒8.6%, p<0.01).
Table 3 summarizes the results of the Wilcoxon signed-rank test and ICC-aa values for a comparison of AMH values measured by each assay under various storage conditions relative to fresh controls. All AMH measurements taken in stored samples had excellent ICCs and Pearson correlations with those in fresh controls, whereas the Wilcoxon signed-rank test indicated differences between AMH values according to storage conditions. Only in sera stored for 48 hours (both at 0 to 4 Ōäā and ŌĆō20 Ōäā) did the Wilcoxon signed-rank test reveal no significant difference between the Access-AMH values.
With delayed serum separation, the decrease in rev-Gen II-AMH was 13.2%┬▒7.7% after 48 hours and 17.6%┬▒11.8% after 1 week, relative to fresh controls (p<0.001 for all) (Table 4). The Access-AMH level had increased by 5.5%┬▒8.5% after storage for 48 hours (p<0.05) but had decreased by 7.2%┬▒6.2% after storage for 1 week, again relative to fresh controls (p<0.001).
Overall, little change was noted in the Access-AMH assay results across storage conditions compared with rev-Gen II-AMH.
Discussion
The goals of this study were to investigate the agreement between the rev-Gen II-AMH and Access-AMH assays and to evaluate the effect of sample storage conditions on the reproducibility of each AMH assay.
The optimal statistical approach to assess the degree of agreement between old and new assays is not obvious, but many studies have described the product-moment correlation coefficient as an indicator of agreement [12]. Comparative studies have shown high correlations (r>0.99) between the Access and rev-Gen II assays [7,13,14]. Similar results were obtained in our study. However, two serious problems limit the use of correlation coefficients. First, a correlation depends on the range and distribution of the variables. Second, a correlation ignores any systematic bias between the two variables. Furthermore, the true AMH values in a sample are unknown, and we can only estimate relative bias between two AMH assays. Therefore, in the present research, an additional comparison study using the Bland-Altman method was performed. Some discordance between AMH assays is inevitable, and what matters is whether we can accept the degree of disagreement between the two AMH values. The main objective of the Bland-Altman approach is the comparison of experimentally observed deviations with a preset clinical acceptance limit [15].
Clinical users have no choice but to rely on manufacturersŌĆÖ claims and package inserts containing precision information. Data provided by manufacturers often reflect better precision than is achieved in clinical practice. According to the package insert of the Access kit, values obtained with the Access assay are equivalent to those reported with rev-Gen II for the critical range of 0.16 to 10 ng/mL, with 4.0% bias [16]. Previous studies have also revealed good correlations between these values, along with differences that fall within clinically acceptable ranges, indicating that the methods are interchangeable [13,14]. However, discordance of approximately 11% to 22% between values obtained by rev-Gen II and Access has been reported [4]. Furthermore, similar discordance has been demonstrated between the rev-Gen II and Elecsys assay values [17]. Comparisons have been performed between frozen serum samples or between fresh and frozen-thawed serum samples [4,14,18].
We compared samples under the same conditions, and our results also showed considerable discrepancy between the AMH measurements obtained by rev-Gen II and Access (Table 2), which was consistent with earlier studies reporting a difference of 9% to 11% between the two methods [7,13]. As Figure 3 shows, the points on the Bland-Altman plot were uniformly scattered between the LOAs, which may suggest good agreement between the two measurement methods. However, the relatively wide span of the LOA and the considerable differences observed would not be negligible in clinical settings. Despite manufacturer suggestions that the Access assay offers standardized results consistent with rev-Gen II through the use of identical antibodies and calibration, such discordance raises potential issues concerning Access performance [4,7]. If a consistent bias is present, adjusting for it is simple. However, widely spaced LOAs and discrepancies based on the storage of samples constitute a much more serious problem. Although a conversion factor can be generated by linear regression methods, the conversion from rev-Gen II-AMH into Access-AMH is potentially highly inaccurate [19].
While the cause of such discrepancies is unclear, the systematic nature suggests that a calibration error of one method or the high inter-laboratory variability of the manual AMH assay documented in AMH external ring trial schemes are potential causes of bias [20-22]. Because the lack of universal calibration means that the AMH values are quite different compared with values from manual assays, one should not compare absolute AMH values between clinical studies that use different assays [1,4]. To maximize the clinical utility of AMH measurement, it is also critical to develop an international standard for AMH assessment [1].
Published studies involving the Bland-Altman technique have indicated various acceptable differences, but few have described the rationale for this choice [23]. Because AMH is used with age-specific reference values and several diagnostic cut-off levels, it is difficult to determine the acceptable degree of disagreement. The mean percentage difference has been compared to the acceptable change limit (ACL) according to ISO 5725-6 as an alternative to the acceptable degree of disagreement [24]. The ACL for interpreting a measured difference is based on the analytical imprecision (CV) according to the formula ACL=2.77├ŚCV [25]. Assay precision was evaluated for both intra- and inter-run precision using AMH quality control material consisting of human recombinant AMH (Beckman-Coulter) at three known concentrations [14]. A CV of 4.96% was obtained from in-house routine mean data collection of the quality control value over 6 months, and the ACL was calculated as 13.74%. Considering the ACL of Access, the discrepancy between rev-Gen II-AMH and Access-AMH may constitute a clinically acceptable level.
Imprecision caused by analytical variation has significantly decreased in recent times due to automation. Although analytic variation can be reduced by the judicious choice of methodology and by adherence to strict standard operating procedures, it can never be eliminated entirely, and a growing body of evidence has demonstrated that the quality of laboratory results cannot be assured merely by focusing on purely analytical aspects [26].
Perhaps one of the most important clinical advances in the recent medical literature on AMH is the recognition of the meaningful pre-analytical variability in AMH results, which must be considered for appropriate interpretation in clinical care [6]. In clinical practice, the pre-analytical phase is usually poorly standardized; it is very difficult to control all of the pre-analytical components, such as the conditions of sample transport, storage, and handling. Recent works have established that the original Gen II assay was significantly susceptible to pre-analytical variability, and the rev-Gen II assay yielded more consistent results regardless of storage conditions [27]. Previous studies have shown that two fully automated immunoassays exhibited excellent analytical performance, superior to the current manual assay [13]. However, reproducibility of the automated assay has not yet been adequately confirmed. Our study showed that all AMH measurements by each assay had excellent ICC and Pearson correlations, whereas the Wilcoxon signed-rank test indicated that AMH values across sample storage conditions were less reliable for most measurements. All three statistical methods appeared to support that the Access-AMH level remained unchanged versus baseline only for the first 48 hours at 0 to 4 Ōäā and ŌĆō20 Ōäā. In contrast, Access-AMH showed a significant decrease after 1 week of storage, which corresponds well with the results of earlier studies [7,18]. The time-dependent stability of the Access-AMH measurements in stored serum at 0 to 4 Ōäā/ŌĆō20 Ōäā was superior to that of the rev-Gen II-AMH measurements. Antibodies in the automated kit may be unaffected by complement, allowing for stable assay performance over time. Our study also showed that storage at 0 to 4 Ōäā is sufficient to maintain a proper assay outcome at ŌĆō20 ┬░C for up to 7 days.
Concerns about the long-term stability of serum AMH remain unresolved. Long-term stability is essential in epidemiological studies involving longitudinal laboratory results, but it is hindered by various challenges, such as changes in analysis methods. We found only two papers on long-term stability, only one of which involved an evaluation of AMH stability using the same AMH method [7,9]. Demirdjian et al. [7] reported that long-term storage of samples at ŌĆō20 and ŌĆō70 Ōäā for up to 15 months had no significant impact on AMH level measured with Access. In contrast, we found a significant increase in AMH values measured with rev-Gen II and Access after 2 years of storage, but the magnitude of difference for Access-AMH was small (average, 4.5%).
Whole blood stability testing is necessary in clinical laboratory situations. The performance of AMH tests in infertility clinics lacking appropriate laboratory facilities has led to the use of clinical laboratory services utilizing dispatch collected into serum tubes with gel separators [10]. In a practical setting involving blood sampling in weekend sessions, AMH analysis may be performed after 48 hours on the Monday after a weekend during which whole blood in a serum separator tube was kept at room temperature. This means that blood samples may be centrifuged 2 to 3 days after collection and not processed according to recommended protocols, especially over weekends. Researchers must understand the impact of this delay on AMH results. We found only one study about Access-AMH changes caused by storage in serum gel tubes at room temperature with delayed centrifugation. That research indicated that the variation between days 0 and 6 was <5% and that unseparated serum gel tubes can easily be stored at room temperature or couriered to a remote assay service without the need for centrifugation and refrigeration for up to 6 days [7]. Our results indicated that the change in the Access-AMH level over time was smaller than the change in the rev-Gen-II-AMH level, and storage in unseparated serum gel tubes for 1 week at room temperature profoundly influenced the rev-Gen II-AMH measurements (with an average decrease of 17.6%, constituting a clinically significant result) (Table 4). The stability of Access-AMH during storage at room temperature with delayed centrifugation suggests that using the Access assay may decrease enzymatic problems in AMH measurement.
This study has limitations due to its small sample size and use of only a single measurement for each assay system. Additionally, the limits of maximum acceptable differences (expected LOAs) could not be defined a priori, based on clinical necessity.
This study confirmed that the sample storage condition is a major pre-analytical variable. This suggests that samples should be tested with the same storage conditions when comparing AMH values between patients. Compared with rev-Gen II, the automated assay is superior given its pre-analytical stability. Repeated future studies are required to minimize variabilities in AMH measurement.