


Introduction
Serum estradiol (SE) measurement is a fundamental tool widely used for monitoring patients during controlled ovarian hyperstimulation (COH). Patients with poor ovarian response often exhibit low SE levels during COH, which correlate with a relatively low number of oocytes retrieved and subsequent low fertilization rate [1,2]. High SE levels are associated with ovarian hyper-response and an increased risk of ovarian hyperstimulation syndrome [3]. Both low and extremely high SE levels are associated with poor cycle outcomes [4]. During COH, follicles grow in an estrogen-dependent environment [5]. Preovulatory follicle development is directly related to the production of estrogen using androgens as a substrate. In vitro studies have demonstrated that estrogen has autocrine and paracrine activities, expressed by the enhancement of follicle-stimulating hormone (FSH) to stimulate cell division; additionally, estrogen stimulates the expression of luteinizing hormone (LH) and FSH receptors and induces aromatase activity [6-10].
Estrogen affects the rate of androgen aromatization into estrogens [11], which crucially provide the follicle with a suitable microenvironment and facilitate further development [12]. An improper increase in follicular estradiol is related to the failure of granulosa cells to respond to FSH; this, along with a reduction in aromatase activity, is likely to result in follicular atresia [13]. Decreases in SE during COH have been previously reported in several clinical contexts: following gonadotropin-releasing hormone (GnRH) antagonist administration [14-16], following the intentional dose reduction of gonadotropins, and spontaneously with no apparent reason [17,18]. In the past, cycles with decreasing SE levels, either spontaneous or intentional, during COH were considered unfavorable and could prompt cycle cancellation [4]. Hitherto, there is still considerable ambiguity concerning the detrimental effect of spontaneous SE decreases [18].
A key limitation of much of the literature on spontaneous SE decreases is the small sample size and the lack of data on subsequent cycles, leaving the question of whether this is a repetitive phenomenon unanswered. To fill this gap in knowledge, the present study aimed to explore the effects of spontaneously decreasing SE levels on COH cycle outcomes.
Methods
1. Setting
We retrospectively analyzed all fresh in vitro fertilization (IVF) GnRH antagonist cycles that took place at a hospital IVF unit between January 2010 and December 2017.
2. Study and control cycle selection
We included all cycles with a mid-to-late follicular phase decrease in SE levels. A decrease in SE was defined as any SE measurement with a lower value than a previous measurement. Measurements were obtained after drawing peripheral venous blood during ovarian stimulation. The interval between exams ranged from 2 to 3 days.
First, we excluded cycles with an SE decrease preceded by a decrease in the gonadotropin dose. Next, we excluded cycles with a decrease in the SE level preceded by the initiation of a GnRH antagonist within 72 hours of taking the blood sample (patients underwent phlebotomy every 1-2 days following GnRH antagonist initiation). The cycles included in the final analysis had at least one measurement showing an increasing SE level after GnRH antagonist initiation before the measurement in which the SE level decreased (Figure 1). For the control group cycles, we searched for a subsequent cycle, within 6 months and from the same patient, in which an antagonist protocol was used. We included more than one cycle for a patient if it met our main inclusion criteria for another, separate COH cycle. While LH levels were not assessed in all patients, no incidence of premature ovulation was encountered in the study (SE decrease) or control cycles. In patients who successfully became pregnant from the study cycle, we looked for a previous cycle within 6 months to include as a control cycle.
2. COH protocol
COH was initiated on day 2 of the menstrual cycle using recombinant FSH (Gonal-f, EMD Serono, Darmstadt, Germany; Puregon, Merck & Co., Kenilworth, NJ, USA) for the first 4–5 days, and the subsequent human menopausal gonadotropin (Menopur; Ferring Pharmaceuticals, Saint-Prex, Switzerland) dosage was adjusted according to the patient’s ovarian response. Administration of a GnRH antagonist (Cetrotide, EMD Serono) was initiated according to a flexible protocol when the leading follicle reached 12 mm. An ultrasound scan and SE blood measurements were then taken from day 4 of gonadotropin administration until the day of human chorionic gonadotropin (hCG) triggering. Recombinant hCG (Ovitrelle 250 mg, Serono) was used for the final trigger. The number of cases requiring intracytoplasmic sperm injection was similar between the groups, at approximately 60%.
We supported the luteal phase with micronized vaginal progesterone (Utrogestan, Seid, Madrid, Spain; Endometrin, Ferring) at 800 mg/day for 14 days until the serum β-hCG level was determined 14 days after embryo transfer. In the case of a positive β-hCG result, follow-up was maintained until confirmation of clinical pregnancy by the presence of a positive fetal heartbeat on an ultrasound scan. Data concerning pregnancy outcomes were recorded. Ovarian stimulation parameters including the protocol type, total FSH dose, starting and ending FSH doses, and SE levels were measured before and after the day of the SE decrease, and the SE level on the day of hCG triggering was collected for all patients.
3. Hormone assays
SE levels were measured using an electrochemiluminescence immunoassay with an analyzer (cobas e; Roche Diagnostics, Basel, Switzerland). The estradiol assay employs a competitive test principle using two monoclonal antibodies specifically directed against 17β-estradiol. The limit of detection was set at 18.4–11,010 pmol/L (5–3,000 pg/mL).
4. Primary and secondary outcomes
The outcome data included the primary outcome of the number of oocytes retrieved and secondary outcomes of accurate classification of the maturation stage of oocytes (metaphase II [MII], MI, germinal vesicle, or atretic), fertilization rate (formation of two pronuclei), number of embryos, and number of top-quality embryos. Top-quality day-3 embryos contained 6–8 cells, and the blastocysts in both groups exhibited an inner cell mass and a trophectoderm layer with no or minimal (≤ 20%) fragmentation. For the purpose of the calculation of clinical pregnancy rate, data included only fresh embryo transfer cycles so as to include the influence of estradiol decrease on the endometrium. The policy for embryo transfer was to transfer one to three cleavage-stage embryos (in accordance with the recommendations of our assisted reproductive society) or one blastocyststage embryo according to the patient’s age, medical history, and the number of available embryos. The number of embryos frozen, the implantation rate, and the clinical pregnancy rate (with clinical pregnancy indicated by the presence of a positive fetal heartbeat on an ultrasound scan) were documented. Data concerning pregnancy and fetal outcome were recorded.
5. Sample size
The sample size was calculated based on the average number of oocytes retrieved at our IVF unit during the study period. We estimated that a sample size of 204 women (102 in each group) would be sufficient to detect a 25% difference in the number of oocytes retrieved with 80% power using the two-tailed test and a type I error rate of 0.05.
6. Statistical analysis
Categorical variables such as a decrease in the SE level were described as frequencies and percentages. The normality of continuous variables was evaluated using a histogram and a Q-Q plot, and values were described as medians and interquartile ranges (IQRs) or as means and standard deviations. Continuous variables were compared between categories using the paired samples t-test or the Wilcoxon ranked test, while categorical variables were compared using the chi-square test or the Fisher exact test. Linear multivariate regression analysis was used to determine which factors were significant independent predictors of the number of MII oocytes obtained.
All statistical tests were two-sided, and p < 0.05 was considered to indicate statistical significance. All statistical analyses were performed using IBM SPSS ver. 25 (IBM Corp., Armonk, NY, USA). This study was conducted in accordance with the ethical principles outlined in the Declaration of Helsinki and approved by the ethics committee of Barzilai Medical Center (No. BRZ-32-18). and this retrospective study was exempt from obtaining patient consent.
Results
Of the 2,417 cycles included in the initial cohort, we selected 107 cycles with a spontaneous decrease in the SE level for analysis (Figure 1). A total of 409 cycles exhibited an SE drop during ovarian hyperstimulation prior to hCG administration; of these, 107 GnRH antagonist-protocol cycles met the inclusion criteria for a spontaneous SE decline and had a subsequent COH cycle available within 6 months for use as a self-control.
The median patient age was 33 years (IQR, 29–38 years), and 72% of patients had primary infertility. The most frequent cause of infertility was male factor infertility (38%), with other causes specified in Tables 1 and 2. All women had normal cycle day 2 ± 2 (IQR, 1–4) serum FSH levels (median, 6.0 ± 3.9 mIU/mL) and SE levels (median, 60.8 ± 30 pg/mL). Twelve participants had two instances of decreased SE levels, and one participant had three cycles with spontaneous SE decreases before hCG triggering.
The starting dose (study group, 200 IU [IQR, 150–300 IU]; control group, 225 IU [IQR, 150–300 IU]; p = 0.079) and total dose (study group, 2,512 IU [IQR, 1,500–3,600 IU]; control group, 2,362 IU [IQR, 1,612–4,050 IU]; p = 0.094) of gonadotropins did not significantly differ between the two groups. Cycles with a spontaneous SE decrease had lower median SE levels on the day of hCG triggering (SE decrease, 899.7 pg/mL [IQR, 193–2,116 pg/mL]; control, 1,566.8 pg/mL [IQR, 249–2,970 pg/mL]; p < 0.001).
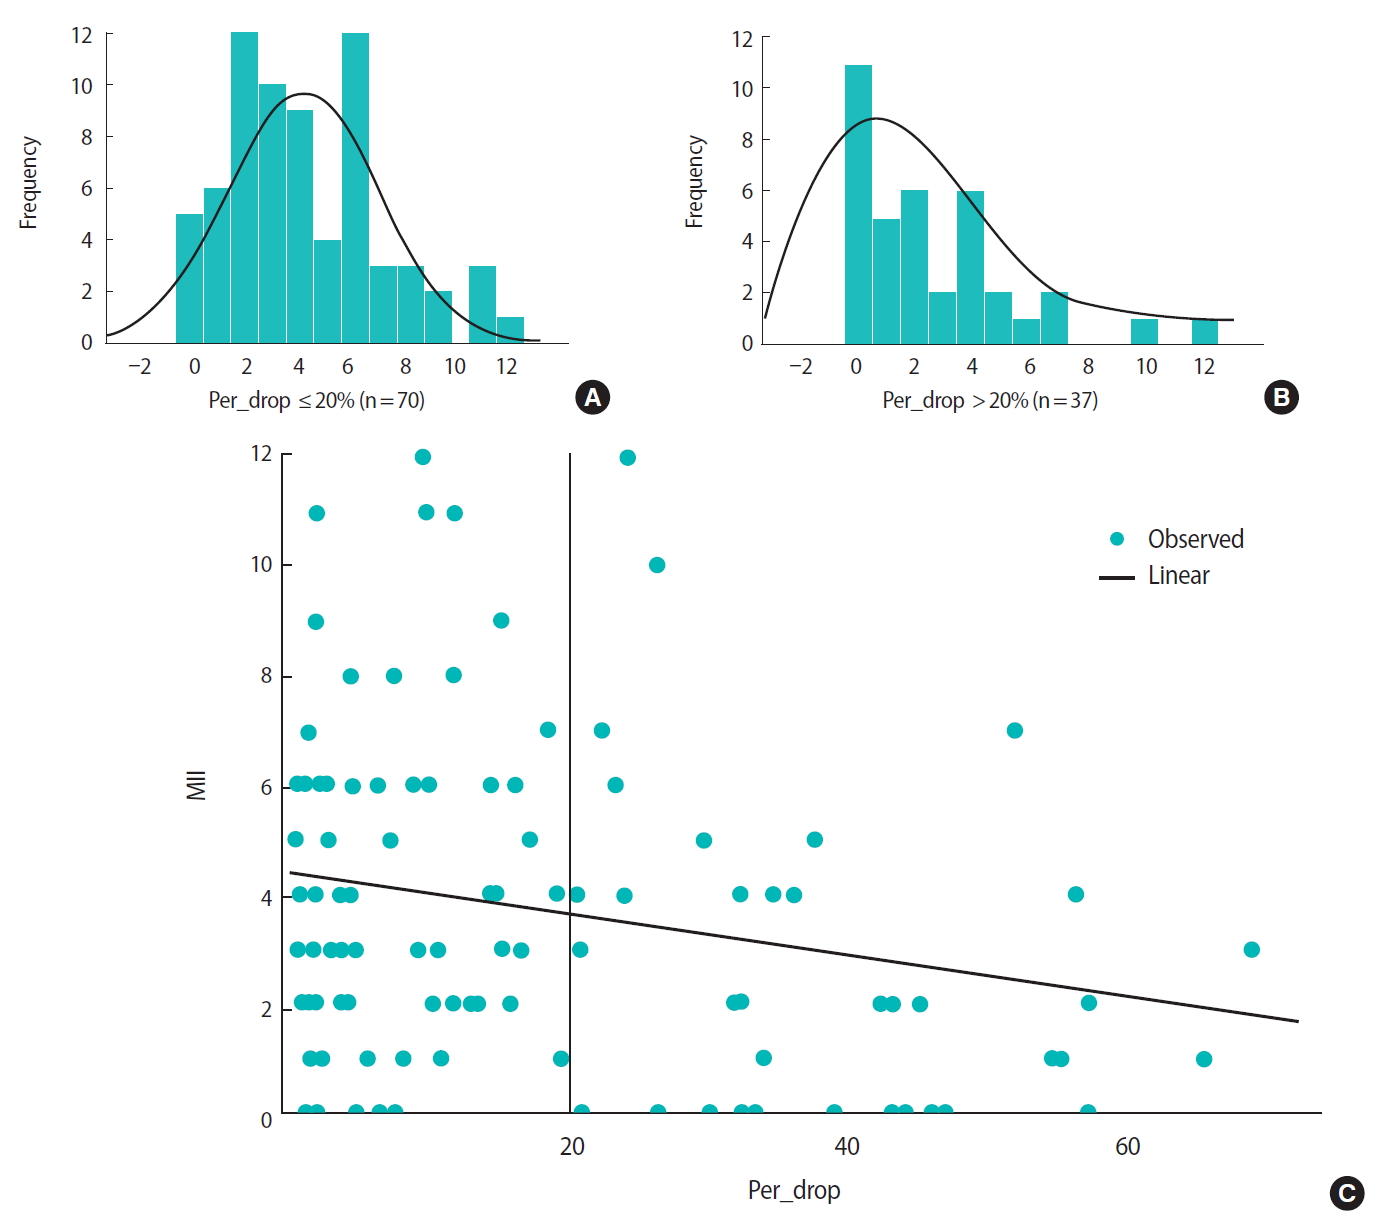
In the study group, the median rate of spontaneous SE decrease was 18% (IQR, 3%–30%). Compared to the control group, the study group had a significantly lower median total number of oocytes (6 [IQR, 3–9] vs. 3 [IQR, 1–6]; p = 0.002) and a significantly lower median number of MII oocytes (4 [IQR, 2–6] vs. 2 [IQR, 0–4]; p = 0.001) retrieved. The fertilization rates were similar between the two groups. The cycles with an SE decrease had significantly fewer cleavage-stage and blastocyst-stage embryos than the control cycles (cleavage-stage embryos: 3 [IQR, 1–6] vs. 4 [IQR, 2–7], respectively; p = 0.012; blastocyst-stage embryos: 0 [IQR, 0–2] vs. 0 [IQR, 0–4], respectively; p = 0.001) (Table 3). Significantly more cycles had no embryo for transfer in the study group than in the control group (19.6% vs. 13.1%, respectively; p = 0.03). The implantation and clinical pregnancy rates were similar between the two groups (15% in the study group vs. 12.4% in the control group; 23% in the study group vs. 22% in the control group, respectively; p = not significant for both). Linear correlations were observed between the percentage decrease in SE level and the numbers of total and MII oocytes retrieved (Figure 2). In a sub-analysis, cycles with an SE decrease of > 20% had significantly fewer total retrieved oocytes (3 [IQR, 1–8] vs. 6 [IQR, 3–9]; p = 0.019) and MII oocytes (2 [IQR, 0–4] vs. 4 [IQR, 2–6]; p < 0.001) than cycles with ≤ 20% SE decrease. Other cycle outcomes are shown in Table 3.
Discussion
This study aimed to explore the effect of a spontaneous SE decrease on IVF cycle outcomes and to evaluate whether this adverse event repeated in subsequent COH cycles. We found that a spontaneous SE decline before hCG triggering during COH resulted in the retrieval of fewer total oocytes and fewer MII oocytes than in subsequent self-control cycles. A correlation was observed between the percentage of the SE decrease and the number of retrieved oocytes. Spontaneous SE decreases repeated in later cycles, but not in the immediately subsequent cycle.
Previous studies [4,17-19] have investigated the effects of SE decline by retrospectively comparing the study group to a control group of age-matched patients who exhibited a regular pattern of rising SE. Two studies compared patients under long agonist protocol stimulation with different primary outcomes and showed partially conflicting results. Styer et al. [18] showed similar live birth and miscarriage rates between the groups, whereas Fisher et al. [17] reported a detrimental effect of spontaneously decreasing SE on IVF outcomes, including the clinical pregnancy rate. In some measures, our results corroborate the findings of the latter study, as we found significantly lower numbers of total oocytes, MII oocytes, and obtained embryos in the cycles with a spontaneous SE decrease than in the subsequent control cycles. However, the study by Fisher et al. [17] did not detect a correlation between the percentage decrease in SE and the clinical pregnancy rate, whereas our data showed a linear relationship between the percentage decrease and the number of oocytes retrieved. When SE levels dropped by 20%, we observed a 50% reduction in oocytes retrieved. In our cohort of patients, the spontaneous decline in SE did not repeat in the very next cycle. However, 13 participants exhibited more than one cycle with a spontaneous SE decrease, with one patient having three COH cycles with SE decreases over 1 year of IVF treatment. The characteristics of participants with more than one SE decrease were similar to those of patients with a single SE decrease.
Patients with a spontaneous SE decrease have been previously characterized as exhibiting the features of poor responders [17]. Our results showed that the majority of patients in our study group had a perfectly normal response in the subsequent cycle, suggesting that the socalled poor ovarian response might be attributed to an abnormal cohort of follicles resulting in a poor cycle outcome, rather than to genuine poor responder status. The most prevalent cause of infertility in our patient cohort was male factor infertility (38%). Furthermore, Lindheim and Morales [19] showed an SE decrease following GnRH antagonist initiation in oocyte donor cycles, which strengths our argument that the SE decrease should not be attributed to poor response.
In a group of 14 ovum donors, a significantly lower clinical pregnancy rate was reported in patients with an SE decrease than in patients without such a decrease, but no significant differences were found in the stimulation characteristics or the number of retrieved MII oocytes [19]. This finding is interesting, as one would expect these parameters to follow the same trend. While the authors were able to use the oocyte donation model to distinguish the impact of the SE decrease on follicle growth from the effects of uterine factors, they proposed that the detrimental effect on pregnancy rate via embryo quality was a result of abnormal folliculogenesis that could not be detected via the standard morphological parameters used to classify embryo quality.
In the present study, we used a single-subject study model, where each patient served as her own control, for two main reasons. First, within the limitations of a clinical retrospective study, a self-control design comparing COH results within a relatively short period may potentially minimize bias stemming from ovarian factors. Second, we sought to understand whether a spontaneous decrease in SE levels is a repetitive phenomenon. A repeat of the SE decline in later cycles could suggest that this is not an accidental event, which could justify further testing for this group of patients. However, the ideal model should take a scientific approach that includes analysis of the follicular fluid and granulosa cells of each aspirated follicle as well as endometrial biopsy to explore uterine factors.
The exact etiology behind the spontaneous decline in SE level is not well understood. In the past, a decrease in SE level prior to hCG administration was attributed to follicular atresia or premature luteinization [13,20]. One possible explanation for this abnormal ovarian response in GnRH antagonist cycles is oversuppression of LH by the GnRH antagonist in the late follicular phase, when it is most necessary for androgen production as a substrate for estrogens [7]. FSH and LH are necessary for the continuation of follicular development [7]; LH stimulates the production of androgen substrate by theca cells [7,21,22] and, in the late follicular phase, acts in synergy with FSH [8]. We can speculate that the spontaneously decreasing SE level served as a reflection of the well-being of the follicle cohort recruited in the period corresponding to the studied COH cycle. Taking a step back, in the growing secondary follicle, the presence of estradiol in the local internal network between oocyte and granulosa cells contributes to an increase in C-type natriuretic peptide, oocyte-derived factors, and receptors for estradiol, FSH, and LH on the multiplying granulosa cell, together resulting in a healthy cohort of antral follicles [21].
This was a retrospective study, and data involving follicular fluid analysis were not available. Other limitations were the potential of selection bias and the relatively small size of the study group, although compared to the published data, the present study contains the largest study group of subjects with spontaneous SE decreases. We did not observe a significant change in the clinical pregnancy rate; however, this study may have been underpowered for that parameter. Since an endometrial biopsy was not available for analysis, endometrial factors could not be appropriately assessed. However, the endometrial thickness was normal in both groups. Hence, within the limitations mentioned, we did not observe a clinically visible detrimental effect on the endometrium.
The strengths of our study are the investigation of the same biological environment in both groups; the same GnRH antagonist protocol was used in the study and control cycles, and the total amount of gonadotropins did not differ between the cycles. We showed that spontaneously decreasing SE levels had a detrimental effect on IVF outcomes. The possible adverse impacts on folliculogenesis, embryo development, and even uterine receptivity may differ for each cycle. Growing follicles may express different quantities or isoforms of FSH receptors, other metabolites, and biological substances, influencing the follicular response to external gonadotropins [23,24].
Bridging the gap in knowledge with combined clinical and basic research may lead to a better understanding of the stimulated follicle environment in patients with spontaneously decreasing SE levels. In the future, we may be able to use this information to determine proper modifications to established protocols and offer patients evidence-based management options.