The relationship of sperm DNA integrity with serum vitamin levels (folate and cobalamin) and food consumption in infertile men
Article information

Abstract
Objective
The aim of this study was to investigate the relationships of serum folate (vitamin B9), cobalamin (vitamin B12) levels and diet with semen parameters (semen standard parameters [SSP] and DNA fragmentation index [DFI]) in infertile men.
Methods
Sperm samples were assessed for SSP and DFI (using the sperm chromatin dispersion test). Serum vitamin concentrations were measured with an immuno-electrochemiluminescence assay, and men completed a semi-quantitative food frequency questionnaire (FFQ).
Results
Serum folate levels were positively correlated with sperm progressive motility and DFI. A comparison of SSP between two groups of patients according to serum folate concentration (B9 <4.840 ng/mL and B9 ≥4.840 ng/mL) showed significantly higher sperm concentration and sperm progressive motility in the latter group. However, there was no difference between these groups regarding DFI. Interestingly, serum folate levels were significantly higher in patients with a high DFI (using the cut-offs of 30% or 18%). FFQ data showed that the consumption of fruits and egg yolk correlated positively with sperm concentration and sperm motility, respectively.
Conclusion
Serum folate levels showed significant associations with sperm concentration and sperm progressive motility. However, the positive association of serum folate with DFI raises the need for careful prescription of folate supplements.
Introduction
Infertility is an important health concern worldwide. Approximately 15% of couples do not achieve pregnancy within a year of regular unprotected sexual intercourse [1]. It is estimated that up to 50% of infertility cases are due to male reproductive disorders [2]. However, the etiology of failure to conceive remains unknown in 30% of infertile men [3].
Beyond semen standard parameters (SSP), sperm DNA integrity is also associated with fertility. Nevertheless, the routine analysis of sperm DNA fragmentation (SDF) is not yet a common practice [4]. Studies are actively being conducted to understand the role of DNA and chromatin integrity, as well as exogenous factors such as lifestyle, in human fertility. Therefore, diet has been a core focus of many studies in the last decade.
Indeed, many biological processes in male and female fecundity depend on compounds derived from the diet [5]. Furthermore, substantial changes in dietary behavior can induce serious malformations in offspring [6]. At the molecular level, micronutrients such as folate (vitamin B9), riboflavin (vitamin B2), niacin (vitamin B3), cobalamin (vitamin B12), and zinc play fundamental roles as substrates or cofactors in DNA synthesis and methylation within the one-carbon cycle [7,8]. Hence, many studies, reviews, and meta-analyses have investigated the relationship between fertility and diet. However, most of the literature comprises studies that were carried out in Western countries or in Asia, and studies are still scarce in Africa, particularly in North Africa, which is characterized by distinctive dietary patterns.
Among the micronutrients, vitamins B9 and B12 are water-soluble vitamins that are involved in DNA metabolism. Vitamin B9 plays the role of a coenzyme in one-carbon metabolism, which is necessary for deoxythymidylate synthesis, purine synthesis and various methylation reactions [9-11]. Vitamin B12 is involved in general (together with its coenzymatic form, methylcobalamin) in the reactions that lead to de novo synthesis of thymidine, essential for DNA replication and repair [12].
The aim of this study was to investigate the relationship between food consumption, as estimated by a semi-quantitative food frequency questionnaire (FFQ) and the blood concentration of vitamins (folate and cobalamin), as well as the relationship of vitamin concentrations with SSP and SDF. This study was conducted among infertile men from a North African population, providing novel insights on the relationship of the specific diet of this region with male infertility.
Methods
1. Study population
A total of 29 infertile men were included in this cross-sectional study. These patients underwent routine semen and blood analyses as part of biological investigations of their infertility at Ibn Rushd Laboratory of Medical Analysis. Obtaining a larger sample was hindered by the fact that patients often consider collecting a semen sample for analysis to be awkward and embarrassing. Information on smoking, alcohol consumption, and chemical exposure during occupational activities was collected through a questionnaire. The study was approved by the Institutional Consultative Committee of Ethics of the National Center for Biotechnology Research (CRBt). All the participants provided informed written consent.
Approximately 64% of the patients suffered from primary infertility. All but two patients had engaged in at least 1 year of regular unprotected sexual intercourse with their partners. For those two patients, semen analysis had revealed a case of asthenozoospermia for one and azoospermia for the other.
2. Semen analysis
1) Semen sampling
Semen was obtained by masturbation after a period of sexual abstinence of 3 to 5 days. Semen samples were collected in sterile containers and liquefied at 37°C within 30 minutes.
2) Physicochemical analysis
After liquefaction, semen volume, pH, and viscosity were assessed. According to the World Health Organization guidelines [13], the reference values were as follows: volume ≥1.5 mL, pH ≥7.2, and normal viscosity.
3) Computer-assisted sperm analysis
Concentration, motility, and morphology were measured using a semen quality analyzer (VideoTesT–Sperm 2.2 software, VideoTest Ltd., St. Petersburg, Russia) that was connected to an optical microscope (model MT4300L, Meiji Techno Co., Ltd, Saitama, Japan) coupled to a ProgRess camera microscope (Jenoptik, Jena, Germany). An aliquot of 2 µL of the semen sample was deposited on a disposable counting chamber (Leja Products, Nieuw Vennep, Netherlands) measuring 10 µm in height. Many fields of the sample were examined to reach a total of 200 spermatozoa. May-Grunwald-Giemsa staining was used to evaluate the morphology.
Oligozoospermia was diagnosed when the sperm concentration was less than 15 million/mL. The lower limit of normal sperm morphology was 4% and if the progressive motility (PM) was less than 32%, the diagnosis of asthenozoospermia was established [13].
3. Sperm chromatin dispersion test
The DNA fragmentation was assessed by a sperm chromatin dispersion test using a Halosperm G2 kit (Halotech, Madrid, Spain). Briefly, fragmented sperm DNA is denatured by an acid. Following this, a second treatment that consists of a lysis solution removes nuclear proteins. When there is slight or no DNA breakage, a halo is observed around the sperm head that is absent in sperm with degraded DNA. The halo is very small when there is meaningful DNA damage [14,15].
According to the manufacturer’s instructions, the semen sample was diluted to obtain a maximum of 20 million sperm per milliliter. Then, 100 μL of agarose was melted at 95°C to 100°C for 5 minutes and then transferred to a temperature of 37°C for 5 minutes. After that, 50 μL of semen was mixed with agarose, and 8 μL of the cell suspension (semen and agarose) was deposited on the treated side of the slide on a cold surface and covered with 24×24 mm coverslip. Next, the slide was transferred into a refrigerator at 4°C for 5 minutes. The coverslip was removed and the cell suspension was incubated in the denaturation solution (solution 1) for 7 minutes. After removing the reagent, the slide was incubated in the lysis solution (solution 2) for 20 minutes. When solution 2 had been removed, the slide was washed with abundant distilled water for 5 minutes. Incubation in 70% ethanol followed by 100% ethanol was applied for 2 minutes each . After drying, Diff-Quik staining was used to allow visualization under a bright field microscope (model MT4300L). SDF was estimated after counting at least 300 sperm cells to calculate the DNA fragmentation index (DFI), as suggested in previous research [15]:
The average of DFI from two slides’ readings was calculated unless there was a notable difference between the two readings. In this case, a third reading was necessary.
4. Blood analysis
Before collecting the blood samples, patients were asked to fast for at least 8 hours. The blood was collected in a dry tube and centrifuged at 2,000×g to obtain serum samples. Folate and cobalamin concentrations in blood serum were calculated using an automated immuno-electrochemiluminescence assay, which is a competitive assay (Cobas E601, Roche Diagnostics, Basel, Switzerland), following the manufacturer’s instructions. Briefly, a first step in dissociating the serum vitamin from its carrier protein is performed and followed by the addition of ruthenium, which binds to the carrier protein. Subsequently, biotinylated vitamin and streptavidin microparticles were added to the mixture. The subsequent chemiluminescence reaction allowed the quantification of the ruthenium-carrier protein complex, which is proportional to the quantity of the tested vitamin.
5. Food frequency questionnaire
Participants completed a FFQ containing the food categories that were studied in a National Health Survey [16]. It was developed in order to estimate the frequency and the consumption of foods known to be rich in folate and cobalamin during the precedent year. The FFQ was filled out by the patients themselves. This FFQ consisted of 76 food items, including traditional meals, distributed into 10 categories: cereals and pasta; meat, seafood; vegetables, fruits, legumes; dairy products and eggs; sweets (including biscuits, donuts, and pastries [traditional, pies, cakes, etc.]), nuts (referring to any hard-walled, edible kernel); and seasonal foods.
The frequency of consumption was expressed by scores from 0 to 12 as follows: 0, never; 1, once a year; 2, 2–5 times per year; 3, 6–11 times/year; 4, once a month; 5, 2–3 times/month; 6, once a week; 7, twice a week; 8, 3–4 times/week; 9, 5–6 times/week; 10, once daily; 11, twice daily; and 12, three or more times/day. For seasonal foods, the scores were from 0 to 11 as follows: 0, never; 1, once a season; 2, twice a season; 3, once a month per season; 4, 2–3 times/month in the season; 5 once a week in the season; 6, twice a week in the season; 7, 3–4 times/week in the season; 8, 5–6 times/week in the season; 9, once daily in the season; 10, twice daily in the season; and 11, three or more times/day in the season. The questionnaire was provided on the day of semen and blood collection and was returned on the day when the participant received the results.
6. Statistical analysis
To assess the relationships between different parameters of semen, blood, and nutrients, Spearman correlation coefficients were calculated. The non-parametric Mann-Whitney U test was used for comparisons between groups with high and low values of semen or blood parameters. We conducted the analysis by setting the cut-off value of DFI to 18% and then to 30%, as recommended in previous studies [17,18], respectively. Data were expressed as median (range) with a 95% confidence interval (CI). The threshold for statistical significance was set as p<0.05. Analyses were performed using GraphPad Prism version 7.00 (GraphPad Software, San Diego, CA, USA).
Results
1. General description of the study population
The general characteristics of the study population, the sperm parameters, and serum vitamin levels are summarized in Table 1. The median and range of age and body mass index were, respectively, 35 years (range, 24–50) and 26.0 kg/m2 (range, 18.9–36.9). The median abstinence time was 3 days (range, 3–5).
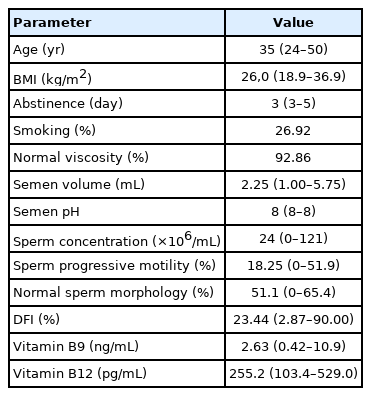
General characteristics of men, sperm parameters, and serum vitamin concentrations
The median value of PM (18.25%) was lower than the reference limit (32%). Half of the studied population has asthenozoospermia, 25% were oligoasthenozoospermic, and 7.14% were azoospermic. Teratozoospermia was found in 3.57% of participants.
2. Vitamins and SSP
We found that 86.21% of men had a serum folate concentration less than the inferior limit of the normal range adopted in the laboratory (4.840–14.960 ng/mL), while only 20.69% of the patients had a serum vitamin B12 concentration less than the reference value (191–946 pg/mL). A significant correlation was also observed between serum folate and PM (r=0.396; 95% CI, –0.002 to 0.685; p=0.045) (Table 2). However, there was no correlation between SSP and the serum concentration of vitamin B12.

Association between semen parameters and vitamins
We compared the SSP values between patients with serum folate (vitamin B9) levels <4.840 or ≥4.840 ng/mL, according to the threshold of the normal value according to the clinical laboratory instructions. We found a significant difference between these groups in the sperm concentration (22×106/mL [range, 0–121] vs. 50×106/mL [range, 35–89], p=0.0308) and PM (17.4% [range, 0%–40.3%] vs. 32.7% [range, 30.1%–51.9%], p=0.0169). The same comparison of two other groups of patients distributed according to the serum vitamin B12 status (B12 <191.0 pg/mL and B12 ≥191.0 pg/mL) did not show a significant difference. The results of the different comparisons are summarized in Table 3.
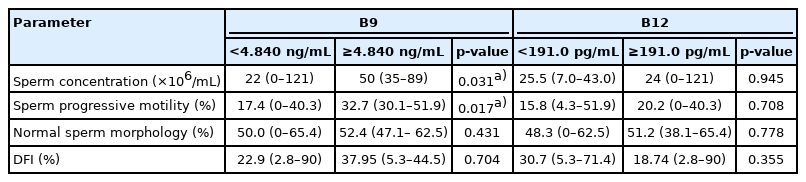
Comparison of SSP and DFI according to the concentration of vitamins
3. Vitamins and DFI
There was no significant difference in DFI between the two groups of patients distributed according to the folate or the vitamin B12 threshold (Table 3). However, a strong correlation was found between serum folate and DFI (r=0.517; 95% CI, 0.151–0.759; p=0.0068) (Table 2). When patients were grouped according to a DFI threshold of ≤18% versus >18%, a significant difference was found in folate concentrations (1.35 ng/mL [0.42–10.49] vs. 2.75 ng/mL [0.66–10.90], p=0.0459) (Figure 1). The same comparison was carried out, but with a DFI threshold of 30% (DFI ≤30% and DFI >30%) (Figure 1). Once again, the only observed difference was in folate concentrations, but with a higher degree of significance (1.765 ng/mL [0.42–10.49] vs. 3.375 ng/mL [1.85–10.90], p=0.0084), confirming the results of the serum folate and DFI correlation analysis (Table 2).
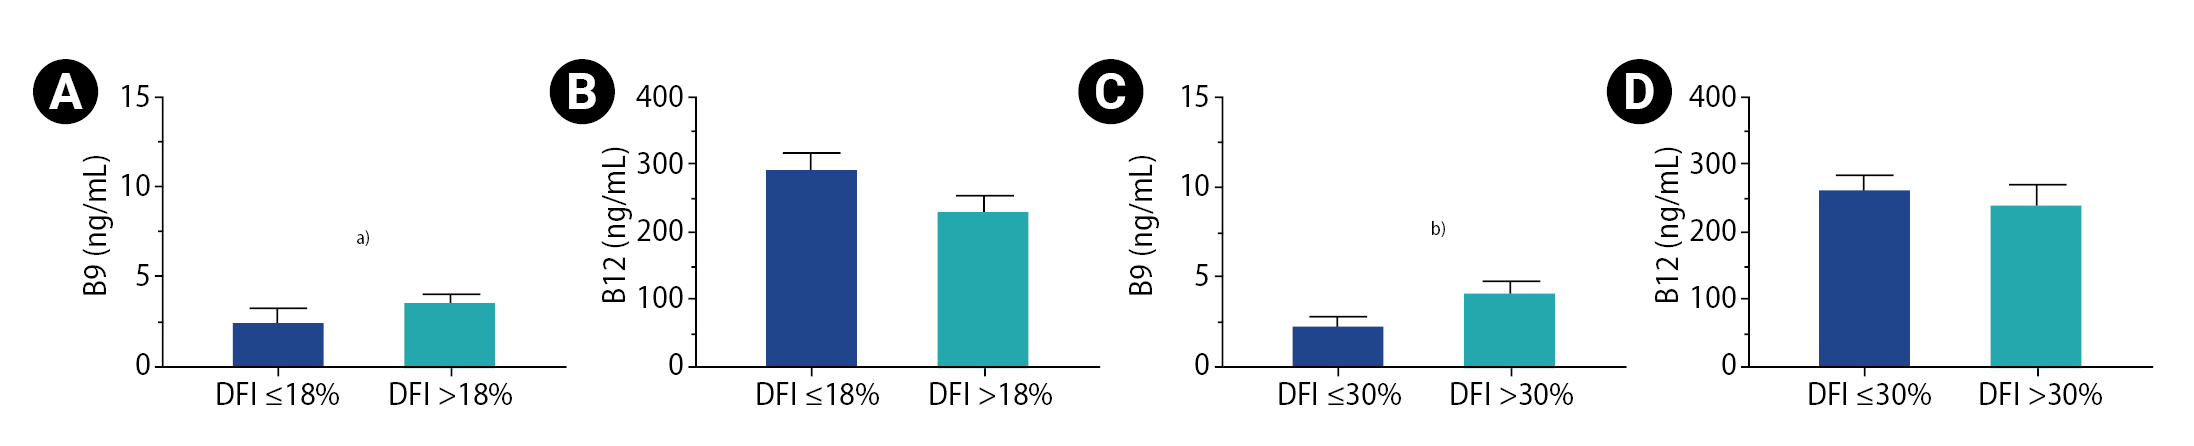
Comparison of vitamin concentrations according to DNA fragmentation index (DFI). (A) Concentration of vitamin B9 in the 18% threshold groups. (B) Concentration of vitamin B12 in 18% threshold groups. (C) Concentration of vitamin B9 in the 30% threshold groups. (D) Concentration of vitamin B12 in the 30% threshold groups. Superior limits of boxes represent means; whiskers represent the standard error of the mean. a)p<0.05; b)p<0.01.
4. FFQ data
Table 4 shows the results of the correlation analysis for each group of food items with either serum vitamin (folate and vitamin B12), the SSP, and the DFI. A positive correlation was found between the serum vitamin B12 concentration and the consumption of organ meat (also called “offal”) (r=0.464; 95% CI, 0.039–0.747; p=0.0297) and between the consumption of fruit and the sperm concentration (r=0.503; 95% CI, 0.091–0.769; p=0.0169). There was also a negative correlation between folate concentration and sweets consumption (r=–0.458; 95% CI, –0.743 to –0.032; p=0.032).

Correlation of food group consumption with blood and sperm parameters
Table 5 shows the results of the same correlation analysis, but taking into consideration food items that were quite rich in folate (liver, breakfast cereal, egg yolk, lettuce, spinach, and nuts [any hard-walled, edible kernel]) or in vitamin B12 (liver, fish, shrimp, Camembert cheese, or egg yolk). We found an association between PM and egg yolk consumption (r=0.478; 95% CI, 0.031–0.766; p=0.033) and between vitamin B12 and the consumption of Camembert cheese (r=0.423; p=0.0498) (Table 5).
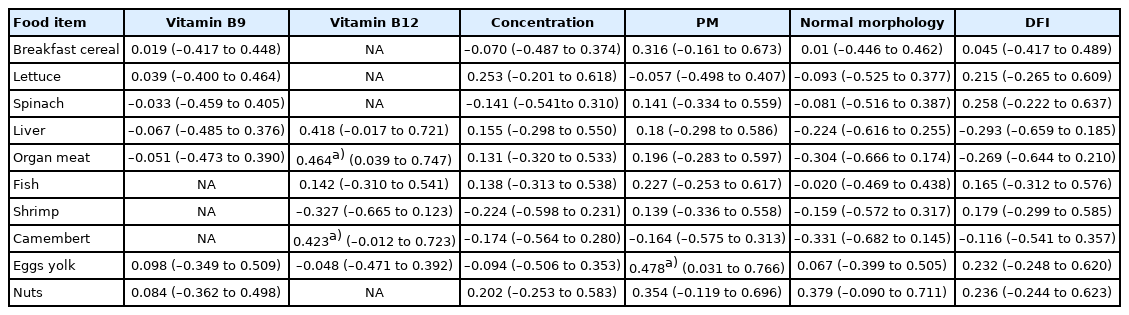
Correlation of some food items that are quite rich in folate or cobalamin with blood and sperm parameters
Discussion
In this study, we assessed the relationships between the serum concentrations of two vitamins implicated in DNA metabolism (folate and vitamin B12) and food consumption, as well as with SSP and SDF, in the context of male infertility. To the best of our knowledge, this is the first study to study the associations of all these parameters at the same time. In addition, our study included a diet from the North African region. The North African diet is based on traditional dishes and is characterized by its diversity and a high intake of fruits, vegetables, fish, and unsaturated fat.
Most of the men in our study suffered from at least one SSP anomaly, and most of them had deficient folate status. We have found that SSP (specifically, sperm concentration, and PM) are associated with serum folate concentrations. This is in line with previous studies that found positive correlations between sperm concentration and serum folate levels and demonstrated that folate deficiency impaired spermatogenesis [19]. A recent systematic review and meta-analysis concluded that an association exists between paternal folate status and sperm quality [20]. It is interesting that sperm folate levels are 1.5 times higher than serum folate levels [21], and both concentrations are correlated [22]. Hence, we can speculate that our results can be explained by the higher concentration of sperm folate and its effects on spermatogenesis.
However, we did not find any significant associations between SSP and serum vitamin B12 concentrations. The same result was reported by Boxmeer et al. [23] and Murphy et al. [24], but Boxmeer et al. [23] described a correlation between SSP and semen cobalamin instead. This correlation between SSP and the seminal (and not the serum) levels of cobalamin has been recently reported in the context of morbid obesity [25]. Nonetheless, the effect of cobalamin supplementation on sperm parameters remains unclear. Even though a review [26] concluded that vitamin B12 can improve sperm count and motility, the absence of any vitamin B12 influence has been reported in many other studies. In a recent preliminary study [27], combination therapy of antioxidant supplements, including vitamin B12, only improved sperm motility. In our study population, we compared biochemical and seminal parameters between the patients who took vitamin supplementation (including vitamins B9 and B12) and those who did not. The differences were not significant (data not shown). Therefore, it seems that other factors might influence the association of serum vitamin B12 levels with SSP. Cobalamin metabolism is complex and includes several turning points, any of which may be polymorphic between individuals. For instance, the correlation of cobalamin concentrations between blood and semen suggests its transfer between the two compartments. Hence, studying molecular variability in this transfer will be very interesting.
We found a surprising positive correlation between serum folate and DFI. Few studies are available on the relationship between circulating folic acid and SDF in humans. The only available study [23] showed no correlation between them, but reported a negative correlation between seminal folate and DFI. Most of the literature is about the effect of folate supplementation on SDF. In the same vein as our study, a recent study showed an increase of SDF following high-dose folic acid supplementation (5 mg daily intake, corresponding to more than 10 times the 400 μg recommended daily allowance) for 6 months, combined with zinc [28]. The same high-dose did not show a significant effect on SDF, but altered the human sperm methylome in another study. This alteration was influenced by the common MTHFR C677T polymorphism [29], which emphasizes the importance of the personal genetic background. It also seems that the dose and duration of folate supplementation affect the way it may influence SDF. Indeed, a recent study confirmed the usefulness of folate supplementation (0.8 mg daily for 3 months) in improving sperm quality, including DNA integrity [30], while a quite similar dose (1 mg daily) but for a longer period (6 months) with other antioxidants failed to show such an effect in another study [31]. Furthermore, a smaller folate dose (0.2 mg daily treatment), even for a duration of 6 months, failed to decrease DFI [32]. In the most recent systematic review that investigated the effect of antioxidant supplementation (together with folate) on semen quality (including SDF) [33], only two studies considered folate and SDF at the same time. Both studies showed that the consumption of a mixture of antioxidants including folate (0.2 mg daily for 3 months) improved sperm DNA integrity [34,35]. In addition to differences in doses and duration of vitamin treatment, and in an attempt to explain all these discrepancies, we can also speculate that these differences may be due to the heterogeneity of the studies and the different sizes of study populations, the use of folate alone or combined with other antioxidants (e.g., zinc or lipoic acid); or polymorphisms in participants’ genes that are involved in folate metabolism. Larger prospective studies comparing multiple arms (with different doses and durations of supplementation) and taking into account participants’ genetic backgrounds would provide insights into the real relationship between folate intake and SDF.
Our semi-quantitative FFQ revealed some interesting correlations that are in accordance with the trends of many studies. For instance, serum folate levels correlated positively with the consumption of egg yolk. Even though vegetables lead the way as a source of folate, eggs are a valuable source as well [36]. We did not find a correlation between serum folate and vegetable or fruit consumption, but we found a positive correlation between the consumption of fruits (known to be rich in vitamins and antioxidants) and sperm concentration. Interestingly, we found that folate levels correlated negatively with sweets consumption. We can speculate that the latter may hinder the efficiency of folate absorption from food because additives such as citrate (widely largely used in sweets) can inhibit the intestinal brush border pteroylpolyglutamate hydrolase, which is required to deconjugate polyglutamyl folate to monoglutamyl folate, a mandatory step prior to absorption [37]. Additionally, we noticed a positive correlation between organ meat or Camembert cheese consumption with serum cobalamin levels. Indeed, cobalamin is produced solely by bacteria and archaea, and the presence of such microorganisms is predominant in animal products [38]. Globally, our FFQ results are in accordance with the trends of many studies. When evaluating the effects of folate and B12 dietary intake, as estimated by a semi-quantitative FFQ, on semen parameters, Najafipour et al. [39] found that higher intake of these vitamins than the cut-offs for the recommended daily intake (B9 ≥0.4 mg, B12 ≥2.4 μg) significantly improved sperm concentration and motility in men with the T allele of the MTHFR gene. However, recent reviews reported inconclusive results regarding the effect of dietary patterns on male infertility. For example, a healthy dietary pattern (like seafood, poultry, whole grains, legumes, skim milk, fruits, and vegetables) could be or not be related to improvements in SSP or SDF [40-42]. Nonetheless, most studies have converged toward a negative impact of unhealthy Western dietary patterns that are rich in fats, red and processed meats, refined grains, sweets and sweetened beverages, pizza, snacks, and mayonnaise. A large study that enrolled 7,282 men from an Asian population [43] showed that the intake of a highly Westernized diet, high consumption of sweet snacks and sugar-sweetened drinks, a high-carbohydrate diet, and a high-sodium diet were associated with decreased sperm concentration, normal sperm morphology, total motility, and PM. Other authors found that the risk of asthenozoospermia could be minimized by a healthy diet [44].
Adding more complexity, it is noteworthy that people do not consume isolated nutrients because diets may contain chemical factors that may improve or impair the fertility potential. Despite the fact that foods like meat, dairy, seafood, fruits, and vegetables are quite rich in vitamins, the effect of toxic residues that they may contain should not be ignored. It has been argued that total fruit and vegetable intake is directly not associated with SSP, but rather that poor-quality SSP may be associated with a high intake of pesticide residue in fruits and vegetables [45]. Interestingly, an evaluation of the pesticide residues in fruits and vegetables showed that, for some pesticides, the acute reference dose was exceeded [46]. Similarly, the presence of estrogens in cow milk was confirmed, and their association with poorer semen quality was established in some studies [47]. In addition, processed meat (by adding chemical preservatives) intake was associated with a lower total sperm count and total PM count [48]. The methylmercury contamination of fish and shellfish is well known [49], as well as the high risk of infertility in men with elevated blood and hair mercury concentrations [50,51]. Hence, the effects of chemical factors may also contribute to some discrepant results between the studies of dietary factors’ associations with sperm quality.
In addition to the influence of the quantity of nutrients and the quality of food, the dysregulation of nutrient transport in the body may influence their biological effects. For example, despite an adequate intake of B12-containing food sources, the hypothesis of malabsorption of this vitamin cannot be discarded [52]. As well, passive or active transport of folate and vitamin B12 from blood to the testis has been proposed [23].
In our study, we found a significant correlation between serum folate concentrations and SSP. The positive correlation between DFI and blood folate concentrations is another interesting finding, which is in line with other recent studies. Hence, we recommend a careful prescription of vitamin supplements (especially folate) in infertile men. A healthier diet should be advised instead. Alternatively, a randomized controlled trial on the effect of folate supplementation on DFI could be recommended in our population. The limitations of our study are a lack of information on semen vitamin concentrations and on patients’ genetic status regarding the main actor proteins in folate and cobalamin metabolism. Therefore, it would be warranted to conduct larger studies that would more exhaustively explore factors such as diet, genetic background, and folate and cobalamin levels in both serum and semen.
Notes
Conflict of interest
No potential conflict of interest relevant to this article was reported.
Author contributions
Conceptualization: SB, GB. Data curation: SB, YH, RL, SB, AB, CZ. Formal analysis: SB. Methodology: GB. Project administration: GB. Writing–original draft: SB. Writing–review & editing: GB.
Acknowledgements
We thank the entire Ibn Rochd Laboratory staff for their technical assistance, as well as Drs. Habib Madjor and Abdelhamid Benchadi for their help.