Inter-ovarian differences in ultrasound markers of ovarian size in women with polycystic ovary syndrome
Article information

Abstract
Objective
The aim of this study was to establish whether differences in ovarian size exist between the right and the left ovary of the same individual in women with polycystic ovary syndrome.
Methods
In total, 206 Korean women with polycystic ovary syndrome were included in this study. In all participants, a transvaginal or transrectal ultrasound examination was conducted in the early follicular phase of the menstrual cycle.
Results
A significant linear correlation was found between the two ovaries with regard to antral follicle count and ovarian volume. The mean antral follicle count in the right ovary (26.75±11.72) was significantly higher than that in the left ovary (23.98±10.85), and the mean volume of the right ovary (11.06±5.17 cm3) was significantly different from that of the left ovary (9.12±4.89 cm3).
Conclusion
Ovarian size is different between the right and the left ovary in women with polycystic ovary syndrome.
Introduction
Ovarian reserve, which refers to the size of the non-growing, or resting, primordial follicle population in the ovaries [1], reflects a woman’s reproductive potential [2]. A variety of methods are used to assess ovarian reserve, of which the main assessment option is transvaginal or transrectal ultrasound assessment of the antral follicle count (AFC), along with evaluation of the serum levels of follicle-stimulating hormone, inhibin B, and anti-Müllerian hormone on day 3 [1,3]. Ultrasound assessment of ovarian reserve can be conducted using two-dimensional (2D) or three-dimensional (3D) ultrasonography [4,5]. In the conventional assessment of ovarian reserve, both ovaries are considered a single entity in the ultrasound examination; however, comparing one ovary with the other may be warranted in certain situations, such as when examining pathological or surgical effects on only one ovary [5]. For example, unilateral ovarian cystectomy is known to lead to a significant decrease of ovarian reserve in the affected ovary compared to the contralateral ovary [6,7]. However, studies using ultrasonography to assess differences in ovarian size between the right and left ovaries are still lacking.
Polycystic ovary syndrome (PCOS) is the most common endocrinopathy of women of reproductive age worldwide, affecting 5% to 10% of women [8]. According to the current Rotterdam diagnostic consensus, the criteria for polycystic ovaries (PCO) as determined by ultrasonography requires either ovary to exhibit an increased AFC (≥12 follicles measuring 2–9 mm in diameter) and/or an increased ovarian volume (> 10 cm3) [9,10]. An elevated AFC and a relatively large ovarian volume are cardinal features of PCOS [4,10-12]. The aim of the present study was to determine whether differences exist in ovarian size between the two ovaries of the same individual in Korean women with PCOS.
Methods
1. Subjects
This study was approved by the Institutional Review Board for human research at the Inje University Haeundae Paik Hospital (IRB No. 129792-2014-035). Korean women aged 18 to 35 years who were newly diagnosed with PCOS at their first visit to the Inje University Haeundae Paik Hospital between June 2010 and December 2014 were included in the study. All patients were diagnosed with PCOS according to the diagnostic criteria set forth by the 2003 Rotterdam consensus [9] after ruling out other pathological conditions such as non-classic congenital adrenal hyperplasia, androgen-producing tumors, hyperprolactinemia, Cushing syndrome, and thyroid dysfunction. All participants met the ultrasonographic criteria for PCO. A modified Ferriman-Gallwey score of > 6 [13] was used to indicate clinical hyperandrogenism, and a serum androgen concentration elevated beyond the 95% confidence limit for Korean women with PCOS [14] was used to indicate biochemical hyperandrogenism. None of the participants had taken medications affecting ovulation, such as oral contraceptives, ovulation induction agents, glucocorticoids, insulin sensitizers, or anti-androgens, in the 6 months prior to the study. Furthermore, patients with a history of ovarian surgery or a suspicious ovarian malignancy were excluded from this study.
2. Measurement of AFC and ovarian volume by ultrasonography
A 2D transvaginal or transrectal ultrasound examination was performed on study participants in the early follicular phase of the menstrual cycle or the period of amenorrhea. A Voluson S7 device equipped with a 7-MHz transvaginal transducer (General Electric Systems, Seongnam, Korea) was used for the ultrasound assessment of all participants, and all of the ultrasound examinations were conducted by the same reproductive endocrinologist in accordance with the international ultrasound guidelines for the assessment of PCO [4]. For each ovary, the AFC of all visible follicles measuring 2–9 mm in diameter was evaluated. The simplified formula for a prolate ellipsoid (0.5 × length × width × thickness) was used to calculate the ovarian volume [4,9]. The total ovarian volume was defined as the sum of the right and the left ovarian volumes, and the total AFC was defined as the sum of the right and the left AFC [12].
3. Statistical analysis
All data are expressed as mean ± standard deviation. All statistical analyses were performed utilizing SPSS ver. 18.0 (SPSS Inc., Chicago, IL, USA). The paired samples t-test was used to compare the sizes of the two ovaries. We used the Pearson correlation coefficient and linear regression analysis to assess correlations between the two ovaries with regard to ultrasound markers of ovarian size. A two-sided p-value of less than 0.05 was considered to indicate statistical significance.
Results
A total of 206 patients were enrolled in our study. Table 1 shows the basal clinical characteristics of all participants. In the correlation analysis, significant linear correlations were observed between the two ovaries with regard to AFC and ovarian volume (Figure 1).
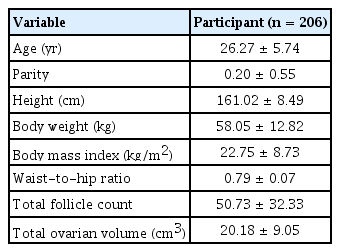
Baseline patient measurements

Correlations between the two ovaries with respect to ultrasound markers of ovarian size in individuals with polycystic ovary syndrome. (A) Antral follicle count (AFC). (B) Ovarian volume (VOL). LO, left ovary; RO, right ovary; r, Pearson correlation coefficient.
Table 2 and Figure 2 show that significant differences were found in ovarian size between the two ovaries in women with PCOS, as determined using 2D ultrasonography. The mean AFC in the right ovary was significantly different from that in the left ovary (26.75 ± 11.72 and 23.98 ± 10.85, respectively; p=0.013), and the mean volume of the right ovary (11.06 ± 5.17 cm3) was different from that of the left ovary (9.12 ± 4.89 cm3).

Comparison of ultrasound markers of ovarian size between the two ovaries in women with polycystic ovary syndrome
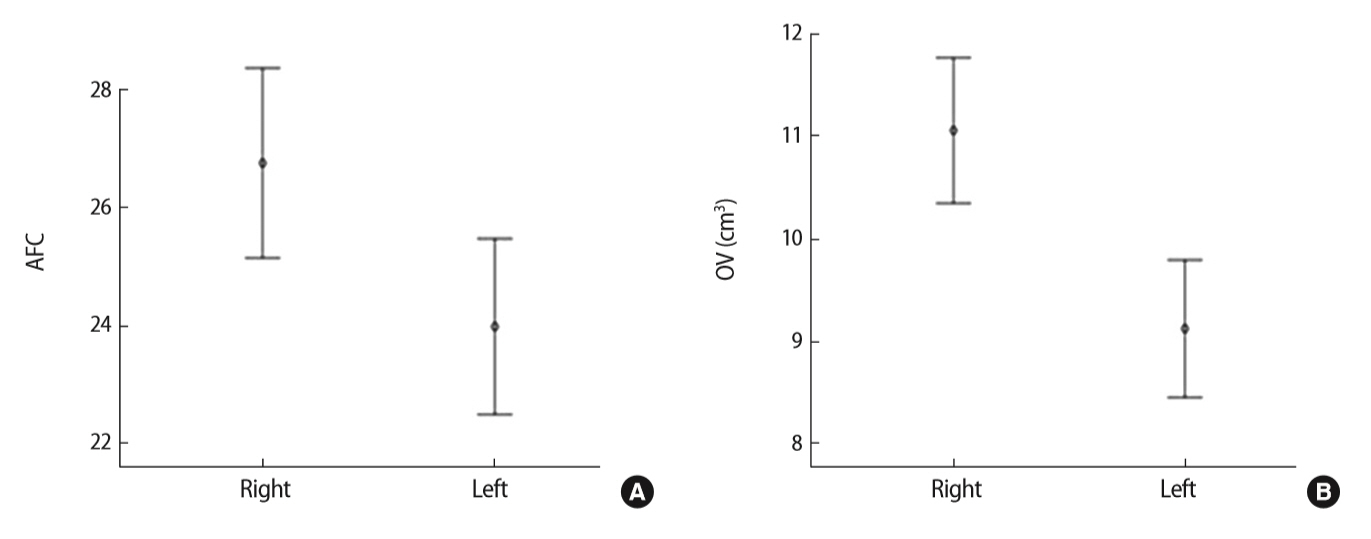
Comparison of the antral follicle count (AFC) and the ovarian volume (OV) between the two ovaries in individuals with polycystic ovary syndrome. (A) 95% Confidence interval of AFC. (B) 95% Confidence interval of OV (cm3).
Discussion
An increased ovarian size observed using ultrasonography is the cardinal feature underlying the diagnosis of PCO [4,9,10]. Accordingly, ultrasound assessment in women with PCOS is highly advantageous for comparing the size of the two ovaries. Additionally, PCO is one of the three diagnostic criteria for PCOS, so an ultrasound assessment of PCO should be performed based on the strict standards set forth by the international consensus [4,15]. In the present study, all ultrasound assessments were performed by the same physician. This standardization in accordance with the published guidelines helped us avoid intraobserver variation in the ultrasound assessment of PCO despite the retrospective design of the study.
No clear explanation exists for the relatively high AFC and ovarian volume that we found in the right ovary. However, two possible explanations can attempt to resolve this finding of inter-ovarian differences in size. First, the configuration of the sigmoid colon may be a factor influencing the incidence of pelvic sidedness [16-18]. The left side of the pelvic cavity may be a less optimal location for ovarian growth than the right side due to decreased space in the left lower pelvic cavity resulting from the S-shaped curve and descent of the left side of the sigmoid colon. A second possible explanation for this finding is the difference in venous drainage between the two ovaries [16-18]. The right ovarian vein generally drains into the inferior vena cava, while the left ovarian vein drains into the renal vein, and this discrepancy may be an additional factor that contributes to the size difference between the right and left ovaries. Jokubkiene et al. [18] suggested that this difference is relatively unlikely to stem from technical factors, such as increased difficulty in obtaining a clear view of the left ovary due to a shadowing effect by the sigmoid colon.
A handful of studies have addressed the issue of size differences between the left and right ovary [5,18-20]. Deb et al. [5] used 3D transvaginal scans to analyze the ovarian volume and AFC of 270 women undergoing a baseline ultrasound assessment in the early follicular phase. Significant differences were found between the two ovaries of an individual with respect to the number of antral follicles measuring > 6.0 mm and ovarian volume, as measured using 3D ultrasound [5]. In addition, Jokubkiene et al. [18] conducted a study of 213 women aged 20 to 39 years old who were using combined oral contraceptives. In that study, 3D transvaginal grayscale ultrasonography was used to estimate ovarian volume as well as the number and volume of antral follicles. The authors [18] reported that in the participants who were 20 to 29 years old, the right ovary was larger (mean difference, 0.5 cm3; 95% confidence interval [CI], 0.22–0.82) and contained more follicles (mean difference, 1.5; 95% CI, 0.52–2.56) than the left ovary; the same trends, but with nonsignificant differences, were seen between the right and left ovary in the 30–39 age group. The results of these two studies were consistent with the results of ours. In contrast, Merz et al. [19] found no significant difference between left and right ovarian volume in premenopausal or postmenopausal women. Tugrul et al. [20] conducted a controlled, prospective cohort study of 80 patients (40 patients with PCOS and 40 as a control group) and found no significant difference between the right and left ovaries with regard to ovarian volume (11.75 ± 5.30 vs. 11.16 ± 4.03 cm3) or number of ovarian follicles (13.87 ± 4.35 vs. 13.95 ± 4.39) in patients with PCOS. Those findings are not in agreement with our results.
The variation in normal ovarian size results from the endogenous production of hormones, which varies with each menstrual cycle [21]. Ovulation and formation of the corpus luteum in the preceding cycle may influence the variation in ultrasound markers of ovarian reserve between the ovaries [5,22]. In the present study, all ultrasound assessments were conducted in the early follicular phase of the menstrual cycle, when the population of follicles in the ovary predominantly consists of antral follicles [5], to minimize the impact of menstrual cycle variation on ovarian size.
The limitations of the present study predominantly stem from its retrospective design and relatively small sample size. In particular, the relatively small number of study participants prohibited us from conducting a subgroup analysis based on age. This study was a preliminary investigation, and we did not investigate other ultrasound parameters such as ovarian stromal echogenicity and ovarian arterial blood flow indices. Additionally, our study is based on results from a 2D ultrasound assessment; this may be an additional limitation, because 3D and Doppler ultrasound examinations, although they are not required in the diagnosis of PCO [4], may be more useful research tools for this purpose than 2D ultrasonography.
In our research, PCO was diagnosed by ultrasonography using the 2003 Rotterdam criteria [9]. Recently, the diagnostic threshold for PCO in either ovary has been amended to ≥ 20 follicles per ovary based on the 2018 revisions to the criteria [23]. Further studies based on the revised 2018 recommendations are warranted.
In conclusion, ultrasonographic observations indicated that ovarian markers of size, AFC, and ovarian volume were significantly different between the two ovaries of an individual in Korean women with PCOS. However, women with PCOS are an underrepresented group in the general population, and these results of inter-ovarian differences as determined by ultrasonography in women with PCOS may not be representative of the population as a whole. Further largescale multi-center trials with subjects from the general population are needed to help clarify these preliminary results.
Notes
Conflict of interest
No potential conflict of interest relevant to this article was reported.