Stereological study of the effects of letrozole and estradiol valerate treatment on the ovary of rats
Article information
Abstract
Objective
Letrozole and estradiol valerate are used to treat some hormonally-responsive symptoms and also in modeling of the polycystic ovary syndrome. However, the stereological analysis of the ovary has received less attention. Estimation of the whole ovary volume using the Cavalieri method can be applied in any orientation desired, but estimation of the mean volume of the oocytes requires isotropic uniform random sectioning. Here, a combined method was developed for estimating the parameters. To our knowledge, no comparison has been made of the effects of letrozole and estradiol on the ovary.
Methods
Sixty rats were divided into 4 groups receiving estradiol (4 mg/kg), olive oil, letrozole (1 mg/kg), or normal saline. After 21 days, their ovaries were studied.
Results
Relative to the control group, the total volume of the ovary and the cortex increased in the letrozole-treated and estradiol-treated rats. In addition, the number of the preantral, antral, and granulosa cells decreased by 43% to 56% in the letrozole- and estradiol-treated rats. On average, a 19% increase was observed in the atretic oocytes of the letrozole-treated and estradiol-treated rats, but the mean oocyte volume decreased by 29% to 44% in letrozole- and estradiol-treated rats. Furthermore, the letrozole-treated rats showed a 5-fold and 7-fold increase in the volume of the cysts and corpus luteum, respectively. A 3-fold increase was found in the volume of both the cysts and corpus luteum in the estradiol group.
Conclusion
The structural changes of the ovary were most pronounced in the letrozole-treated animals.
Introduction
Letrozole is an oral non-steroidal aromatase inhibitor that is used for treatment of hormonally-responsive breast cancer after surgery. Estrogen can be produced by conversion of androgens through the activity of the aromatase enzyme. Binding of estrogens to an estrogen receptor causes cells to divide. It has been shown that letrozole prevents aromatase activity from producing estrogens by competitive, reversible binding to its cytochrome P450 unit. Letrozole produces almost complete inhibition of aromatase in the peripheral tissues and is associated with suppression of estrogen [1,2].
Estradiol valerate is a synthetic ester, specifically the 17-pentanoyl ester, of the natural estrogen, 17β-estradiol. Estradiol valerate is cleaved by esterases in the blood plasma and the liver into 17β-estradiol and valeric acid [3-7]. Many studies have used estradiol valerate to induce a polycystic ovarian condition in rats [3-7].
Furthermore, it is used for treatment of menopausal symptoms, such as hot flashes, night sweats, and vaginal symptoms. It is also prescribed for hormone deficiency in younger women whose ovaries do not produce enough estrogen. However, compared to estradiol itself, estradiol valerate is absorbed more slowly and in a longer time period. The drug has been approved as a four-phasic oral contraceptive and is also indicated for treatment of heavy menstrual bleeding in women without other conditions, such as endometrial polyps or uterine fibroids.
Both drugs are used in modeling the polycystic ovary syndrome (PCOS) in animals including rats [8,9]. Polycystic ovary syndrome affects 5% to 10% of women in their reproductive years. It is characterized by hyperandrogenism, oligo-/anovulation, and multiple cysts [8,9]. Polycystic ovary syndrome has emerged as one of the most common endocrine disorders in women, and seems to be interrelated with the increased prevalence of the metabolic syndrome and its associated cardiovascular and inflammatory risk factors [8,9].
Although many qualitative studies have been conducted on the morphological changes of the ovary after treatment with letrozole and estradiol valerate [2,3,8,9], the quantitative stereological analysis of the ovary has received less attention. Thus, the present study aims to present unbiased stereological methods for quantifying the ovary and answers to these questions: How much does the volume of the ovary, cortex, and medulla change after treatment with letrozole and estradiol valerate? How many oocytes (preantral, antral, and atretic) and granulosa cells are lost after treatment with letrozole and estradiol valerate? How much does the total volume of the ovarian cyst and corpus luteum change after treatment with letrozole and estradiol valerate? How much does the mean volume of the oocytes (preantral, antral, and atretic) and granulosa cells change after the treatment with the drugs? This study provides us with quantitative data to compare the structural changes with letrozole and estradiol valerate.
Methods
1. Animals and tissue preparation
In this study, 60 female rats weighing 200±10 g were randomly divided into 4 groups (n=15): 1) estradiol valerate (4 mg/kg dissolved in 0.4 mL olive oil, single dose intraperitoneal injection) [3,8,9], 2) olive oil (0.4 mL olive oil, single dose intraperitoneal injection), 3) letrozole (1 mg/kg dissolved in normal saline, daily by mouth for 21 days), and 4) normal saline (daily by mouth for 21 days) [2,8,9]. The animals were kept under standard conditions and the experiment was licensed under agreement No. 90-5924 by the Ethics Committee of Shiraz University of Medical Sciences. At the end of the experiment, the rats were anesthetized and their right ovaries were removed and weighed. The ovaries were fixed in 4% neutral buffered formalin. After tissue processing, the samples were blocked in cylindrical paraffin blocks.
2. Stereological study
The ovary was sectioned into isotropic uniform random (IUR) sections [10-14] to estimate the volume of the ovary using the isotropic Cavalieri method. IUR sectioning is necessary for estimation of the oocyte volume using a nucleator. Briefly, the ovary was blocked in cylindrical paraffin blocks. A block was randomly placed on the φ-clock, and each half of it was divided into 9 equal parts. Then, a random number from 1 to 9 was chosen. Afterwards, the block was placed on the θ-clock, and each half of it was divided into 9 unequal sine-weighted parts along its cut surface on the 0-0 axis. Then, a random number was selected, and the cut was made along the selected number (Figure 1). Consecutive 5- and 20-µm-thick sections were prepared using a microtome and stained with hematoxylin and eosin.
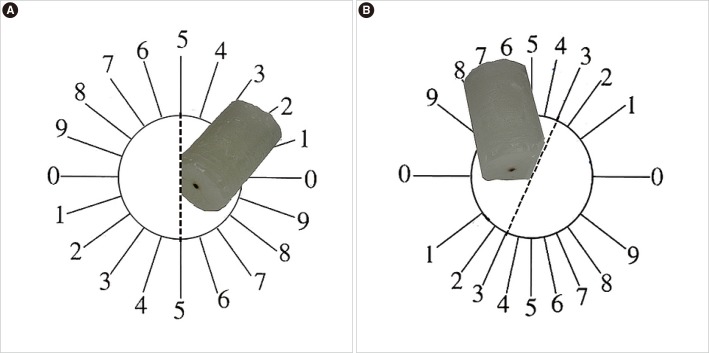
The orientator method for producing the isotropic uniform random (IUR) sections. (A) The cylindrical paraffin-embedded ovary was placed on the Φ clock. After choosing a random number between 1 and 9, the paraffin was cut at that direction (here, it was 5). (B) Then, the paraffin cylinder was located in the 0-0 direction of the θ clock from the cut edge and underwent the second cut at a random number (here, it was 3). Both of the cuts were done in the ovary-free parts of the cylindrical paraffin.
3. Volume of ovary
The Cavalieri method was applied to estimate the total volume of the ovary (Figure 2) at the final magnification of 29× [11,13].

The histological micrograph of the rat's ovary stained with hematoxylin and eosin stain. (A) The Cavalieri method: about 8-12 sections of the total serial sections of the tissue were sampled (here 8) using a systematic random approach. A grid of points was laid out over the sampled ovary sections, and the total number of points hitting the ovary sections was counted. The area per point (a/p) is the area associated with each point and was calculated by the following formula: (a/p)=(X×Y)/M2, where X and Y were the distances between the two nearby points of the grid and M was the final magnification of the image. Scale bar=1,000 µm. (B) Point counting method to estimate the volume density of the cortex, medulla, cystic formation, and corpus luteum. The arrow indicates the right upper quadrant of each cross that was considered to be a point. Scale bar=250 µm.
In doing so, 8-12 systematic random sections were sampled and the volume was estimated using the following formula [11,13]: V (ovary)= p×a (p)×T.
Where p is the total number of points superimposed on the images, T is the distance between the sampled sections, and a(p) is the area associated with each point (here 0.3 mm2).
4. Volume of cortex, medulla, ovarian cysts, and corpus luteum
The point counting method was applied to estimate the volume density of the structures using the following formula (Figure 2): Vv (structure)=ΣP (structure)/ΣP (total).
Where ΣP (structure) and ΣP (total) are the total points hitting the targeted structure and the total points hitting the ovary sections, respectively. On the average, 150 points were counted in each animal.
5. Estimation of the number of oocytes and granulosa cells
Each oocyte subpopulation was classified using the following criteria for recognition during the counting. Preantral oocytes were characterized by the prominent nucleus and surrounded by one or more layers of follicular cells without space (antrum) between the follicular cells. In the antral oocytes, each oocyte was surrounded by follicular cells with an antrum between the follicular cells. Finally, the atretic oocytes contained a pycnotic nucleus and had an irregular shape [13].
The number of preantral, antral, and atretic oocytes and granulosa cells was estimated using a Nikon E200 microscope (Nikon, Tokyo, Japan) which was fitted with a 60× oil immersion objective. The microscopic fields were selected through systematic uniform random sampling by moving the microscope stage at the same distance each time to estimate the number of granulosa cells [10-14]. Then, the ovary sections were analyzed field by field in order to estimate the numerical density of the oocytes. An optical disector design was used to sample the tissue in conjunction with an unbiased sampling frame. In addition, a microcator (MT12, Heidenhain, Traunreut, Germany) mounted on the microscope was used to measure the movement of the stage along the z-axis [10-14]. Then, the number was calculated using the following formula: Nv (cells)=[ΣQ-/(a/f×ΣP×h)] ×t/BA.
where ΣQ- was the counted profile of the oocyte nucleolus or granulosa cells, a/f was the area per counting frame (here, it was 4,900 and 320 µm2 for the oocytes and for granulosa cells, respectively), ΣP was the total counted frames per animal for oocytes and granulosa cells, h was the height of the disector measured using the microcator, t was the mean thickness of the sampled sections (here was 16 µm), and BA was the block advance or the setting of the cutting machine (here 20 µm) (Figure 3).
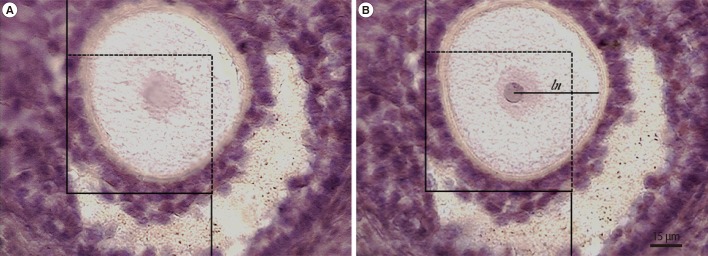
The optical disector and nucleator methods. The numerical density of the cells was estimated using an unbiased counting frame, which was superimposed on the images. Just the cell whose nucleolus (oocyte) or nucleus (granulosa cell) did not appear in the beginning of the dissector height (A) but at the following optical scan (B) was counted. The cell whose nucleus was completely or partly inside the counting frame but only touched the upper and right lines was counted. The intercept length (ln) was measured for estimating the mean oocyte volume. Hematoxylin and eosin stain. Scale bar=15 µm.
6. Number-weighted mean oocyte volume
The volume was estimated using the nucleator method [12,13]. Briefly, the intercept length (ln) from the nucleolus to the border of the cytoplasm of the oocyte was measured on the sampled cells using the unbiased counting frame, and the volume was estimated using the following formula (Figure 3):VN=4π/3×
7. Statistical methods
The results were analyzed by one-way analysis of variance and Tukey's test. The means were considered significantly different if p<0.05.
Results
1. Weight of ovary
On the average, a 45% increase was observed in the ovary weight in the letrozole-treated rats compared to the distilled water group. In addition, an 11% increase was found in the ovary weight in the estradiol group in comparison to the olive oil group. Furthermore, the weight gain of the ovary in the letrozole group was 38% more than that of the estradiol-treated rats (Table 1).

Mean±SD of the weight of the body (g) and ovary (mg) and volume (mm3) of the ovary, cortex, and medulla of the ovary in the letrozole-, normal saline-, estradiol valerate-, and olive oil-treated rats
2. Volume of the ovary
In comparison to the distilled water group, the volume of the ovary had increased by 36% in the letrozole-treated rats. The volume of the ovary in the estradiol group was 18% larger than in the olive oil group. The ovary's volume in the letrozole group was 38% more than that of the estradiol-treated rats. Moreover, the volume of the cortex of the ovary had increased by 26% in the letrozole-treated rats compared to the distilled water group. However, a 20% increase was found in the volume of the cortex of the ovary in the estradiol group in comparison to the olive oil group. Overall, the volume of the cortex in the letrozole group was 23% more than that of the estradiol group (Table 1).
3. Number of the oocytes and granulosa cells
The mean number of the preantral and antral oocytes and granulosa cells had decreased by 43%, 44%, and 52%, respectively, in the letrozole-treated rats compared to the normal saline group. In addition, a 19% increase was observed in the atretic oocytes in the letrozole-treated rats. The number of preantral, antral, and granulosa cells had decreased by 45%, 56%, and 44%, respectively, in the estradiol group in comparison to the olive oil group. Besides, a 19% increase was found in atretic oocytes in the estradiol group compared to the olive oil group (Table 2).

Mean±SD of the number of the preantral, antral, and atretic oocytes and granulosa cells in the ovary of letrozole-, normal saline-, estradiol valerate-, olive oil-treated groups
4. Mean volume of the oocytes
The mean volume of the preantral, antral, and atretic oocytes had decreased by 29%, 36%, and 44%, respectively, in the letrozole treated rats in comparison to the normal saline group.
Moreover, the mean volume of the preantral, antral, and atretic oocytes had decreased, respectively, by 34%, 30%, and 36% in the estradiol group compared to the olive oil group (Table 3).
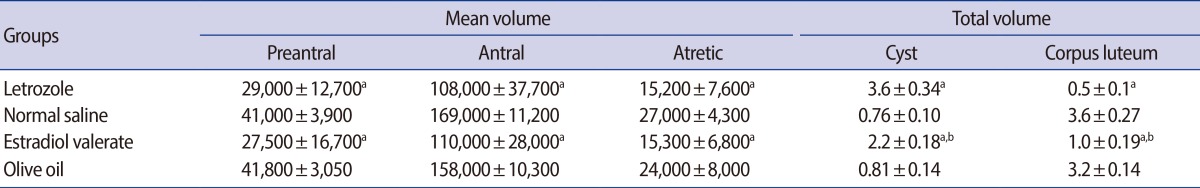
Mean±SD of the mean volume (µm3) of the different oocytes, total volume (mm3) of the cyst and corpus luteum in the ovary of letrozole-, normal saline-, estradiol valerate-, and olive oil-treated groups
5. Total volume of the ovarian cyst and corpus luteum
A 5-fold increase was found in the volume of the cyst in the letrozole-treated rats in comparison to the normal saline group. On the other hand, the volume of the corpus luteum of the normal saline group was 7-fold more than that of the letrozole-treated rats.
Furthermore, a 3-fold increase was observed in the volume of the cyst in the estradiol group in comparison to the olive oil group. Nonetheless, the volume of the corpus luteum of the olive oil group was 3-fold more than that of the estradiol-treated rats (Table 3).
Reconstructed histological sections of the ovary in the control, letrozole-, and estradiol valerate-treated rats are presented in Figure 4. The structural changes, including an increase in the volume of the ovary, cortex, and cysts, were detected in the ovaries treated with letrozole and estradiol valerate. Moreover, a higher number of larger size cysts were observable in the letrozole-treated animals.

Reconstructed histological sections of the ovary stained with hematoxylin and eosin in the control group (A) and the rats treated with letrozole (B) and estradiol valerate (C). The structural changes included an increase in the volume of the ovary, cortex, and cysts, which was detected in the ovaries treated with letrozole and estradiol valerate. The asterisks indicate the cysts. Scale bar=800 µm.
Discussion
This study analyzed the ovarian structure in rats treated with lertozole and estradiol valerate. An increased volume of the ovary, cortex, and medulla was seen in the present study, which is in agreement with other investigations on letrozole treatment [2]. Kafali et al. [2] reported that ovarian morphologic changes in letrozole-induced rats included the development of cysts with hyperplasia of internal theca cells and a thickened ovarian capsule. They reported that the number of corpora lutea decreased, indicating oligo-/anovulation. However, they claimed that unlike in human PCOS, the ovarian weight of the letrozole-induced rats remained unchanged. On the other hand, Manneras et al. [15] showed an increase in the weight of the ovary in the letrozole-treated rats, which is in line with our study findings. Although other researchers indicated that letrazole caused the reduction of corpus luteum, changes in the granulosa cells, and an increase in the number of atretic follicles [8,9], they did not quantify these parameters using stereological methods. However, the results are in agreement with those of the current study. The other drug investigated in this study was estradiol valerate. It has also been used by others to induce PCOS in animal models [8,9]. Brawer et al. [3] reported that the size of the ovary of the estradiol valerate-induced rats was reduced compared to controls. The PCOS ovary is characterized by large cystic follicles with reduced granulosa cell layers and hyperthecosis. They showed that the ovaries from estradiol valerate-induced rats also developed a high incidence of atretic/degenerative secondary follicles and the ovaries were void of postovulatory corpora lutea [3].
The drugs used in the present study have been used for modeling the PCOS in animals [2-9]. The results showed that more cystic formation could be observed in the letrozole-treated rats, and this can be beneficial for the researchers to select a suitable drug for PCOS induction.
A review of the articles published on the issue shows that unbiased quantitative comparison between the drugs has received less attention. The present study made use of stereological techniques to study the ovary as a major part of the female reproductive system. It should be explained that the Cavalieri method used for estimating the ovary volume was integrated with isotropic sectioning. The cavalieri method does not require a special orientation; however, isotropic uniform random sectioning is necessary for estimating some stereological parameters, including oocyte volume. Other parameters, such as length and surface area (for example length of the vessels or surface area of the oocytes), can also be estimated using this combined method.
To the best of our knowledge, no attention has been paid to the estimation of the number of granulosa cells in normal or treated animals. Also, only a limited number of stereological studies have been conducted on granulosa cells [16]. Dhar et al. [16] used two methods to estimate the mean nuclear volume of these cells: the mean number-weighted nuclear volume was estimated by the selector, while the mean volume-weighted nuclear volume was estimated using the point-sampled intercept method. Moreover, some researchers measured the thickness of the granulosa cell layer. Baravalle et al. [17] reported that the thickness of the granulosa cells was significantly smaller in the letrozole-induced cysts compared to other follicles.
The present study revealed the total number of granulosa cells. The estimated number of the granulosa cells should be considered for future studies because of their physiological functions. The main roles of the granulosa cells include production of sex steroids as well as various growth factors thought to act together with the oocyte during its development. The sex steroid production consists of follicle-stimulating hormone stimulating the granulosa cells to change androgens to estradiol [18]. However, after ovulation, the granulosa cells turn into granulosa lutein cells that generate progesterone.
As has been demonstrated by the pioneer stereologists, the density should be multiplied by the reference volume (here, that of the ovary) to avoid the reference trap [11,12]. The reference trap means that relying on the densities alone might lead to the wrong conclusions. Therefore, most of the densities can be estimated using this method, and the total density can be obtained by multiplying the densities by the ovary volume.
Letrozole and estradiol valerate induced structural changes in rats' ovaries and these changes were more pronounced in the letrozole-treated animals. The main structural changes included an increase in the volume of the ovary, cortex, cysts, and corpus luteum, but a decrease in the number and mean volume of the preantral as well as antral oocytes and granulosa cells.
Acknowlegements
This work was performed at the Histomorphometry and Stereology Research Center, Shiraz University of Medical Sciences, Shiraz, Iran. This study is a part of the thesis written by Maryam Ahmadi, M.Sc. student of Anatomy. The authors are grateful to the Research Improvement Center of Shiraz University of Medical Sciences and Ms. A. Keivanshekouh for improving the use of English in the manuscript.
Notes
The work was financially supported by the Research Vice-chancellor of Shiraz University of Medical Sciences (Grant No. 90-5924).
No potential conflict of interest relevant to this article was reported.