Lower growth factor expression in follicular fluid undergone in-vitro fertilization
Article information
Abstract
Objective
This study was performed to identify whether growth and differentiation factor-9 (GDF-9) and transforming growth factor-β1 (TGF-β1) expressions would be lower in the follicular fluid (FF) of those over age 35 who underwent IVF than under age 35.
Methods
A total of 24 IVF cycles (20 patients) were included in this study. All of patients were stimulated for IVF by the GnRH short protocol and divided into two groups for analysis, according to their age: <35 group (14 cycles, 11 patients) vs. ≥35 group (10 cycles, 9 patients). The expression levels of GDF-9 and TGF-β1 were determined by western blotting and quantitative enzyme-linked immunosorbent assay.
Results
The numbers of retrieved oocytes and metaphase II oocytes were significantly lower in the ≥35 group. Lower expression of GDF-9 and TGF-β1 by western blotting in the ≥35 group were observed as well. The mean GDF-9 and TGF-β1 levels by enzyme-linked immunosorbent assay were lower in the ≥35 group. The values were 6,850.5±928.4 ng/L vs. 3,333.3±1,089.2 ng/L of GDF-9 (p<0.05) and 3,844.1±571.1 ng/L vs. 2,187.7±754.0 ng/L of TGF-β1 (p<0.05). A negative correlation between GDF-9 and age was observed (r=-0.546, p=0.006).
Conclusion
GDF-9 and TGF-β1 production from stimulated ovaries during IVF appears to decrease with age.
Introduction
It has been well known that female fecundity, the ability to produce offspring, decreases with increasing chronological age. Studies have shown a clear decline in fecundity after the age of 30 years, leading to fertility loss at a mean age of 41 years [1,2]. In assisted reproductive technology (ART), the success rate declines with age as well [3]. This fact suggests the important implication that the population in the country would be expected to decrease in the future, due to the recent tendency to postpone marriage and childbearing. Although there have been several markers for predicting ovarian response, few studies have shown age-related quantitative differences in growth and differentiation factor-9 (GDF-9) and transforming growth factor-β1 (TGF-β1) from the follicular fluid during IVF.
GDF-9, one of the TGF-β superfamily, is secreted from oocytes during folliculogenesis and it is essential for female fertility and folliculogenesis [4,5]. A GDF-9 deletion results in decreased granulosa cell proliferation, abnormal oocyte growth and follicle development failure [6]. GDF-9 prevents granulosa cell apoptosis and follicular atresia as well [7].
The TGF-β proteins are a member of peptide growth factors that play an important role in regulating growth, differentiation, and metabolism of many mammalian cell types. They belong to a superfamily of structurally related dimeric proteins including activins and inhibins, bone morphogenetic proteins, and Müllerian inhibiting substances [8,9]. In the human follicle, TGF-β1 and TGF-β2 have been found to be produced in both theca and granulosa cells in culture [10]. TGF-β1 might thus be involved in the regulation of follicular growth and oocyte maturation.
Many studies about growth factors in follicular fluid (FF) from the ovary have focused on their biologic role or molecular interactions between oocytes and stromal cells. To our knowledge, no study has been performed to produce the quantitative assay on GDF-9 and TGF-β1 from human FF stimulated for IVF according to age. This study aims to investigate whether GDF-9 and TGF-β1 secreted from oocytes or theca and granulosa cells are correlated with IVF patient age.
Methods
1. Study subjects
Among cases of cryopreserved FF undergoing controlled ovarian hyperstimulation (COS) with GnRH agonist for IVF from January 2009 to September 2011, patients aged 27-44 years, with a basal FSH concentration <10 mIU/mL, no poor ovarian response, and a body mass index of 15-27 kg/m2 were included in this study. The FF samples with any of the following characteristics were excluded: massive blood contamination during collection, no oocyte contained in the FF, total oocyte number ≥15 or ≤3, endometriosis fluid contamination, polycystic ovarian syndrome defined by the 2003 Rotterdam criteria, more than 3,000 IU gonadotropin injection per cycle and ICSI cycle.
A total of 24 IVF cycles from 20 patients were included in this study. The cycles were divided into two subgroups: a <35 group and a ≥35 group, calculated from the experimental date. This study was reviewed by the institutional ethical board.
2. COS
Patients were stimulated with recombinant FSH (Follitrope; LG Life Sciences, Seoul, Korea) and hMG (IVF-M; LG Life Science) along with GnRH agonists, buserelin acetate (Suprefact; Sanofi-Aventis Deutschland GmbH, Frankfurt am Main, Germany) according to the short protocol. Monitoring of follicular development by real-time ultrasound scans was performed from day 5 of gonadotropin injection until the day before follicular puncture. When at least one ovarian follicle had reached 18 mm in diameter, 10,000 IU of HCG (IVF-C; LG Life Science) were administered 34-36 hours before follicular aspiration.
3. FF collection
FF was sampled by trans-vaginal ultrasound-guided puncture and aspiration of follicles with a diameter of at least 15 mm. Fluid from the aspiration tubes without massive blood contamination was carefully collected. The tubes without oocyte were discarded. FF samples were centrifuged at 1,300 g for 10 minutes and stored at -70℃ prior to the experiment.
4. Western blot analyses for GDF-9 and TGFβ1
Western blot was initially used to identify the presence of relative expression differences between the <35 and ≥35 groups. Eighteen FF samples (9 samples from each group) were mixed with 5 X loading buffer and were electrophoresed using 15% sodium dodecyl sulfate-polyacrylamide gel electrophoresis, and then transferred to a nitrocellulose membrane for 90 minutes at 90 V. The blots were blocked with 3% non-fat dry milk in tris-buffered saline, then incubated with primary antibody. The GDF-9 and TGF-β1 were assayed using anti GDF-9 (Santa Cruz Biotechnology Inc., Santa Cruz, CA, USA; GDF-9 [C-20], sc-7407) and TGF-β1 (Santa Cruz Biotechnoloigy Inc.; TGF-β1 [3C11], sc-130348) [11]. After washing, the blots were incubated with anti-goat horseradish peroxidase-conjugated secondary antibodies for 1 hour and washed again. Immunodetection was carried out using an enhanced chemiluminescence peroxidase substrate solution (Elpis Biotechnology, Daejeon, Korea).
5. Assay of GDF-9 and TGF-β1 level in follicular fluid
After identification of qualitative differences by western blot, the levels of GDF-9 and TGF-β1 were measured by the modification of an enzyme-linked immunosorbent assay (ELISA) to verify quantitative differences between the two groups. The samples of FF were diluted 1:10 in assay buffer (NaCl 0.8%, Na2HPO4 0.142%, KH2PO4 0.02%, KCl 0.02%, BSA 0.5%, Tween 20 0.01%, pH 7.4). The ELISA was performed by coating 96-well plates with antibody with specificity for GDF-9 or TGF-β1. After incubating 2 hours at room temperature, the plates were washed, and horseradish peroxydase-conjugated secondary antibody was added to each well. After a further 1 hour of incubation, the plates were washed completely, and 5'-tetramethylbenzidine solution (Invitrogen, Carlsbad, CA, USA) was added to each well. Absorbance at 450 nm was read on a microplate reader (BIOTEKEL-312e; BioTek Instruments, Winooski, VT, USA) [12].
6. Statistical analyses
Statistical analyses were performed with IBM SPSS Amos ver. 19 (IBM, Armonk, New York, USA). Data were analyzed by the Mann-Whitney U test, chi-square test, and Pearson correlation test. A p-value less than 0.05 was considered to be statistically significant. All results are given as mean±SD or SE.
Results
1. Clinical features of the two groups
The mean ages were 32.6±1.6 (<35 group), and 37.3±1.5 (≥35 group). The amount of basal FSH and injected gonadotropin were not shown to be significantly different. Total retrieved oocyte and metaphase II oocyte numbers were significantly lower in the ≥35 group (p=0.011, 0.007). The fertilization rate and clinical pregnancy rate were not significantly different (Table 1).
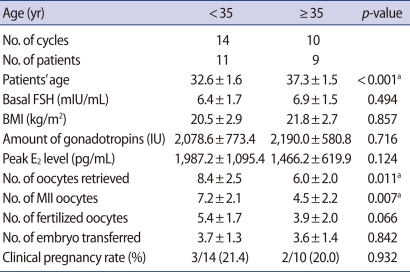
Comparisons of IVF outcomes from under 35 and over 35 groups
2. Western blot for GDF-9 and TGF-β1
All of the bands are shown in Figures 1A and 2A. The GDF-9 bands from each group were detected at 57 kDa. The TGF-β1 band was detected at 25 kDa as well. Densitometric analyses for relative quantitative differences between the two groups showed significantly lower levels in the ≥35 group in Figures 1B and 2B.
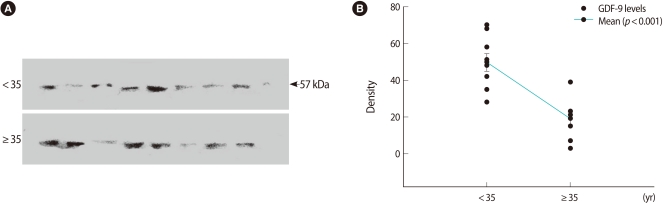
Western blot of relative growth and differentiation factor-9 (GDF-9) expression in follicular fluid. (A) Detection of protein with an approximate molecular weight of 57 kDa from follicular fluid using anti-GDF-9 antibodies. The upper bands are the <35 age group. (B) Numerical values of 18 cases were obtained by densitometric scanning. Values demonstrating the difference between the <35 and ≥35 groups were statistically significant (p<0.001).
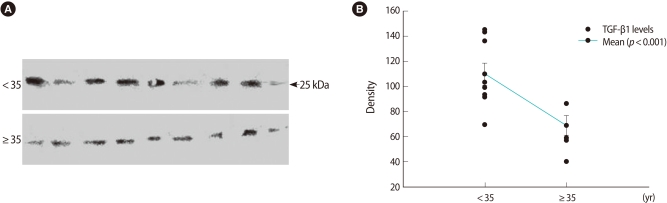
Western blot of relative transforming growth factor-β1 (TGF-β1) expression in follicular fluid. (A) Detection of protein with approximate molecular weight of 25 kDa in follicular fluid using anti-TGF-β1 antibodies. The upper bands are the <35 age group. (B) Numerical values of 18 cases were obtained by densitometric scanning. Values demonstrating the difference between the <35 and ≥35 groups were statistically significant (p<0.001).
3. ELISA for GDF-9 and TGF-β1
A statistically significant difference in the GDF-9 level was observed: 6,850.5±928.4 ng/L (<35 group) vs. 3,333.3±1,089.2 ng/L (≥35 group) of GDF-9 (p=0.004). TGF-β1 also exhibited the significant difference between the two groups: 3,844.1±571.1 ng/L vs. 2,187.7±754.0 ng/L (Figure 3). All values are mean±SE.
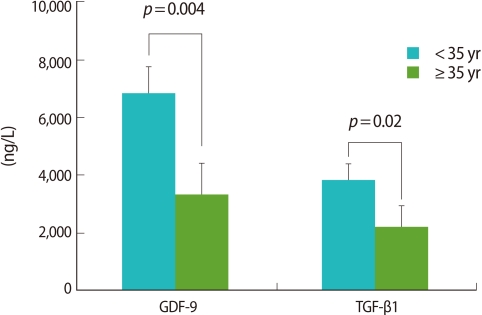
Comparisons of growth and differentiation factor-9 (GDF-9) and transforming growth factor-β1 (TGF-β1) analyzed by enzyme-linked immunosorbent assay. GDF-9 and TGF-β1 levels in the ≥35 group were significantly lower.
4. Correlation analysis between growth factors and age
Both growth factors were correlated negatively with age. GDF-9 showed a stronger negative correlation (r=-0.546) than that of TGF-β1 (r=-0.376). However, a statistical significance was found only in GDF-9 (p=0.07) (Figure 4).
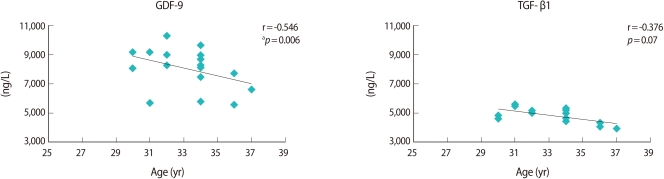
Pearson correlation analysis of growth and differentiation factor-9 (GDF-9) and transforming growth factor-β1 (TGF-β1) between ages and values. ap<0.05.
Discussion
The proportion of infertile couples (failure to achieve a pregnancy within 1 year) reaches 10-20% in women over age 35, in contrast to only 4% for women in their twenties. Moreover, infertility rates may rise to 30-50% for only moderately fecund women of age 35 and over who have tried to conceive for several years [13]. Age-related infertility is usually considered a problem that can be easily solved by assisted reproductive technology. However, the molecular features of the aspirated FF of aged women are not yet known. Many studies on growth factors of FF are concentrated on the production mechanisms or their interactions with each other by using animal models. Therefore, it is meaningful to evaluate whether the expression differences of various growth factors secreted from the ovary exist in humans according to patient age. In the present study, age 35 was chosen as the age for dividing the group into two subgroups.
Recently, GDF-9 has aroused a great deal of interest as a specific oocyte-secreted molecule. It has been thought for a long time that the oocyte is passive in terms of its relationship with follicular somatic cells. However, it has recently become evident that the oocyte in fact is a central regulator of follicular cell function and thereby plays a critical role in the regulation of oogenesis, ovulation rate, and fecundity [14]. GDF-9 is involved in early folliculogenesis, regulation of granulosa cell differentiation, and ovarian function pathogenesis [15]. However, much of its cellular biology remains poorly understood. In the present study, we found that the GDF-9 concentration was significantly lower in the ≥35 group. This might be related to the lower total numbers of oocytes and metaphase II oocytes. However, the pregnancy rate did not differ between the two groups in this study. That is attributed to the small number of cases included.
TGF-β1, one of the TGF-β isoforms (among TGF-β1, TGF-β2, and TGF-β3), an mRNA/protein in the preantral follicles, has been found in several organisms including rodents, humans, sheep, and cattle [16,17]. However, the precise cellular distribution varied according to the species studied, the follicular stage, and most likely, the detection method used. In humans, TGF-β is produced by both theca and granulosa cells, while in sheep, cows, and pigs it is produced mainly in theca cells [18]. In this study, TGF-β1 was chosen as a marker secreted from the theca and granulosa cells, which might reflect ovarian activity. Then, we hypothesized that the TGF-β1 secretion would be influenced by aging. As we had expected, lower expression in the older group was observed.
Previous studies have used individual samples of FF in order to correlate FF substances with oocyte quality and oocyte nuclear maturity assessed by ICSI. However, FF was been collected as a whole without follicle individualization in this study. According to a recent study on GDF-9 and bone morphogenetic protein-15, oocyte and embryo quality are affected by those growth factors [19]. Despite the differing FF collection protocol, we were able to find lower numbers of total oocytes and metaphase II oocytes among the ≥35 group with lower GDF-9 and TGF-β1 levels as well (Table 1). However, other studies using other growth factors, such as inhibin and insulin-like growth factor, showed less consistent results [20,21]. Therefore, more study is needed to verify the growth factor effect on oocyte and embryo quality.
Although it is common to present the control band in western blot experiments, a control band was not presented in this study because there was no well-known protein marker considered as the standard for FF.
Reproductive aging has been the current focus of attention for reproductive medicine. It has been clearly demonstrated that women in their late 30s and early 40s are distinctly less fertile and less likely to conceive than younger women [22]. Recently, raising the infertility rate among older women became a public concern because the low birthrate distorts the population and weaken the country's industry. In recent decades, ART treatment has confirmed that the probability of a live birth decreases distinctly after the age of 35 years. However, few of the molecular characteristics of the aging ovary are known. Studies on the follicular features of the aging ovary are much needed.
In conclusion, lower expression of GDF-9 and TGF-β1 were found in the FF of older women who underwent IVF. This would suggest that the aging ovary has some dysfunction in producing growth factors for follicle development and produces oocytes with poor quality.
Notes
This work was supported by the Dong-A University Research Fund.
No potential conflict of interest relevant to this article was reported.