Epigenetic modification of long interspersed elements-1 in cumulus cells of mature and immature oocytes from patients with polycystic ovary syndrome
Article information
Abstract
Objective
The long interspersed elements (LINE-1, L1s) are a group of genetic elements found in large numbers in the human genome that can translate into phenotype by controlling genes. Growing evidence supports the role of epigenetic in polycystic ovary syndrome (PCOS). The purpose of this study is to evaluate the DNA methylation levels in LINE-1 in a tissue-specific manner using cumulus cells from patients with PCOS compared with normal controls.
Methods
The study included 19 patients with PCOS and 22 control patients who were undergoing controlled ovarian hyperstimulation. After oocyte retrieval, cumulus cells were extracted. LINE-1 DNA methylation levels were analysed by bisulfite treatment, polymerase chain reaction, and restriction enzyme digestion. The Connection Up- and Down-Regulation Expression Analysis of Microarrays software package was used to compare the gene regulatory functions of intragenic LINE-1.
Results
The results showed higher LINE-1 DNA methylation levels in the cumulus cells of mature oocytes in PCOS patients, 79.14 (±2.66) vs. 75.40 (±4.92); p=0.004, but no difference in the methylation of cumulus cells in immature oocytes between PCOS and control patients, 70.33 (±4.79) vs. 67.79 (±5.17); p=0.155. However, LINE-1 DNA methylation levels were found to be higher in the cumulus cells of mature oocytes than in those of immature oocytes in both PCOS and control patients.
Conclusion
These findings suggest that the epigenetic modification of LINE-1 DNA may play a role in regulating multiple gene expression that affects the pathophysiology and development of mature oocytes in PCOS.
Introduction
Polycystic ovary syndrome (PCOS) is a common endocrine disorder that is frequently encountered in women during their reproductive years, with a prevalence of 6% to 15% depending on the diagnostic criteria [1]. PCOS has heterogeneous phenotypic characteristics that include oligo- or anovulation, clinical and/or biochemical signs of hyperandrogenism, polycystic ovaries, the metabolic syndrome, and infertility [1].
The etiology of PCOS is still obscure, and the variability in phenotypic presentation leads to difficulties in diagnosis. The 2003 Rotterdam consensus workshop [2] revised the criteria for the diagnosis of PCOS to include two of the three following criteria: (1) oligo- or anovulation, (2) clinical and/or biochemical signs of hyperandrogenism, and (3) polycystic ovaries.
Many studies have hypothesised the pathophysiological development of PCOS to be multifactorial in etiology. As of yet, no single gene or cluster of genes has been identified as the cause of this syndrome, and many authors believe that this syndrome involves several genes [345]. A difference in the gene expression profiles in cumulus cells taken from PCOS and control patients has been previously reported [5]. Moreover, the intrauterine environment might contribute to the development of this syndrome and fetal androgen exposure inside the uterus [678] has been shown to cause epigenetic changes leading to the development of PCOS.
Previous studies from our labs [9] have shown that the long interspersed elements (LINE-1, L1s), a group of genetic elements that are found in large numbers in the human genome, may be associated with several gynaecologic conditions such as endometriosis [10], gestational trophoblastic neoplasia [11], cervical intraepithelial neoplasia [12], and epithelial ovarian cancer [13]. The methylation changes in LINE-1 might provide insight into the pathogenesis of PCOS. Recently, a new role for LINE-1, in which they translate to phenotype by controlling genes containing LINE-1 expression, has been discovered [14]. Intragenic LINE-1 produce RNA that transcribe in the antisense direction to pre-mRNA and limit the mRNA level. Alteration in gene expression control levels by intragenic LINE-1 has been found in embryonic development, human diseases such as autoimmune diseases, and cancers [151617]. Intragenic LINE-1 RNA controlling gene expression is regulated by several trans-acting factors and epigenetic changes at the LINE-1 promoter [1819]. Moreover, growing evidence [20212223] supports the role of epigenetic modification as the cause of PCOS. Recently, LINE-1 DNA methylation levels were also shown to be associated with Type 2 diabetes mellitus [24]. Hence, methylation modification of LINE-1 in PCOS might provide a clue to the pathophysiology of this disease.
To unravel the role of LINE-1 in the development of PCOS, particularly in terms of methylation, data mining was conducted on gene expression data and LINE-1 characterisation was performed using the Connection Up- and Down-Regulation Expression Analysis of Microarrays (CU-DREAM, http://pioneer.netserv.chula.ac.th/~achatcha/CU-DREAM/) extension program [181925]. For LINE-1 methylation measurement, we selected combined bisulfite restriction analysis (COBRA) instead of pyrosequencing. COBRA for LINE-1 using two restriction enzymes was demonstrated to be able to detect LINE-1 methylation pattern changes, while pyrosequencing can detect only methylation levels [1126].
Methods
1. Mining LINE-1 characteristics
The gene expression dataset GSE 10946 (cumulus cells in PCOS patients vs. cumulus cells in normal controls) was downloaded from the NCBI website (Gene Expression Omnibus, http://www.ncbi.nlm.nih.gov/geo/). Genes containing LINE-1 sequences were obtained from L1Base (http://l1base.molgen.mpg.de). Microarray data were processed using the CU-DREAM software package extension program [181925], which computed the status of each gene using t-test; the genes assessed were then compared with the list of genes containing LINE-1 sequences (Figure 1).
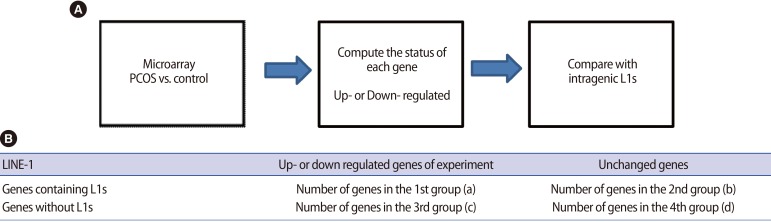
Experimental design of the connection up- or down-regulation expression analysis of microarrays [1825]. (A) Diagram showing the microarray data processing steps. Firstly, input the microarray data for the LINE-1 (L1s) both polycystic ovary syndrome (PCOS) and control. The program then compute the status of each gene (up- or down-regulated) using t-test. Then, the assess genes were compared with a list of genes containing intragenic L1s using Chi-square test. The results showed the comparison between the regulated gene and the presence of L1s sequences for both groups in term of odds ratios and p-values. (B) Table generated from the program. Group (a) includes the genes that are up- or down-regulated and contain intragenic L1s. Group (b) includes the genes that are not up- or down regulated but contain intragenic L1s. Group (c) the genes that are up- or down regulated but not contain L1s. Group (d) the remaining genes that are not up- or down regulated and do not contain L1s.
2. Patient selection
Women with infertility who were indicated for in vitro fertilization/intracytoplasmic sperm injection treatment were recruited for the study after providing informed consent. Nineteen patients with PCOS were assigned to the case group. The diagnosis of PCOS was performed according to the revised Rotterdam criteria (2003) [2] and included two of the three following criteria: (1) oligo- or anovulation with a menstrual interval longer than 35 days, (2) signs of hyperandrogenism, including acne or a hirsutism score of 2 or more by the modified Ferriman-Gallwey scoring system, and (3) polycystic ovaries from ultrasonography (≥12 follicles of 2–9 mm in diameter on at least one ovary). Twenty-two patients with infertility from other causes (non-PCOS) were assigned to the control group. The inclusion criteria were patients 37 years of age or under with a normal body mass index (BMI) of 18.5 to 25 kg/m2. The patients in the control group were diagnosed with other causes of infertility, had regular menstrual cycles with an interval range between 21 and 35 days, no signs of hyperandrogenism, and no ultrasonographic evidence of polycystic ovaries. Patients who were currently or previously on hormonal or metabolic drugs, including metformin, or had an abnormal glucose tolerance test were excluded from the study.
The following were recorded for all patients: age, BMI, duration of infertility, and menstrual history, including cycle length. Acne grading and a hirsutism score, as graded by the modified Ferriman-Gallwey score, were also recorded for PCOS patients. All patients had blood drawn for a baseline hormonal profile, including follicle-stimulating hormone (FSH), luteinizing hormone (LH), estradiol (E2), and prolactin levels on day 2 to 3 of the menstrual cycle. Transvaginal ultrasonography was performed on day 2 of the menstrual cycle to assess the number of follicles.
This research was approved by the Institutional Ethics Committee Review Board of the Faculty of Medicine, Chulalongkorn University.
3. Ovarian stimulation
Patients were assigned to either long agonist or antagonist ovarian stimulation protocols. The dose of exogenous gonadotropin was adjusted according to the follicular response, followed by serial transvaginal ultrasonography and E2 level measurement. When at least three follicles had reached 18 mm in diameter, 250 µg recombinant human chorionic gonadotropin (Ovidrel, Serono, Rockland, MA, USA) was given subcutaneously to induce ovulation. Oocyte retrieval was performed 36 to 38 hours after recombinant human chorionic gonadotropin administration.
4. Cumulus cell preparation
After oocyte retrieval, oocytes were cultured in Global for Fertilization (LifeGlobal, Guilford, CT, USA) containing 10% human serum albumin (LifeGlobal) at 37℃ in 5% CO2 for 2 to 3 hours. The cumulus cells were then removed after brief exposure to 80 IU/mL of hyaluronidase (type VIII from bovine testes, Sigma, St. Louis, MO, USA). After assessment for oocyte maturation by microscopy, cumulus cells were collected by allotment into mature (metaphase II or "M II" oocytes) or immature (germinal vesicle [GV] or metaphase I, "M I" oocytes) tubes in phosphate-buffered saline solution for each patient and stored at –4℃.
5. Evaluation of oocyte quality
After the cumulus cells were removed, the oocytes were rinsed four times and cultured in Global for Fertilization. The oocytes were then oriented using micro-instruments and graded according to characteristics of the cytoplasm and the morphology of the first polar body. After cumulus removal, oocytes were graded into four groups according to the status of the first polar body, the presence of cytoplasmic inclusions, and the size of the perivitelline space. Grade 1 showed a fragmented first polar body and a large perivitelline space; grade 2 showed an intact first polar body and a large perivitelline space; grade 3 showed a fragmented first polar body and a normal perivitelline space; grade 4, the top quality, showed an intact first polar body and a normal perivitelline space. The oocytes were photographed for re-evaluation of the morphology by embryologists. Oocyte maturity is classified as: Mature oocyte, when the oocyte is in metaphase II stage with an extruded first polar body; and Immature oocyte, when the oocyte is in metaphase I or GV stage (Figure 2).
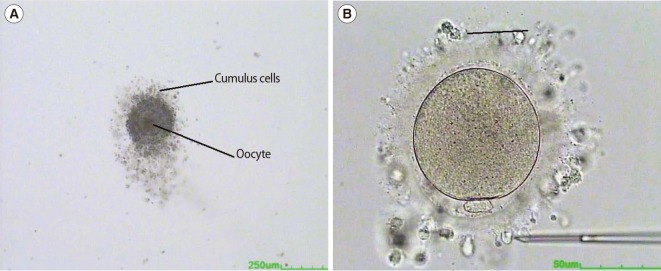
Immature and mature oocytes with cumulus cells (A). Immature cumulus-oocyte complex immediately after retrieval from the ovary. The oocyte cytoplasm contains a germinal vesicle (B). Mature oocyte after partially stripping the cumulus cells from the oocyte. The oocyte is in metaphase II stage with an extruded first polar body.
6. DNA extraction and bisulfite modification
DNA was extracted from cumulus cells by proteinase K digestion and a standard phenol-chloroform extraction protocol. The extracted DNA was eluted and used for bisulfite treatment. Bisulfite modification of genomic DNA was performed using the EZ DNA methylation kit (Zymo Research, Irvine, CA, USA) according to the manufacturer's protocol.
7. COBRA of LINE-1
The bisulfite-treated DNA samples were amplified for 40 cycles by polymerase chain reaction (PCR) using the LINE-1 forward (5'–CCGTAAGGGGTTAGGGAGTTTTT–3') and LINE-1 reverse (5'–RTAAAACC CTCCRAACCAAATATAAA–3') primers at an annealing temperature of 50℃. After PCR, the LINE-1 amplicons (160 bp in length) were digested with TagI and TasI restriction enzymes in NEB buffer 3 (New England Biolabs, Ipswich, MA, USA) at 65℃ overnight. The digested PCR products were then run on an 8% non-denaturing polyacrylamide gel and stained with SYBR green nucleic acid gel stain (Gelstar, Lonza, Allendale, NJ, USA). The intensities of both COBRA-PCR fragments were quantified using a phosphorimager with ImageQuant Software (Molecular Dynamics, GE Healthcare, Slough, UK). Distilled water was used as a negative control. DNA samples from HeLa, Jurkat, and Daudi cell lines were used as positive controls in each experiment as well as for inter-assay variability normalisation. All samples were performed in duplicate.
8. LINE-1 DNA methylation analysis
Following enzyme digestion, the COBRA-LINE-1 amplicons generated 4 bands depending on the methylation status of 2 CpG dinucleotides in the 5' and 3' regions of the sequences and the length of each fragment, as follows: (1) LINE-1 amplicons containing 2 unmethylated CpGs (uCuC), comprised of 62 and 98 bp fragments; (2) LINE-1 amplicons containing 2 methylated CpGs (mCmC), comprised of 80 bp fragments; (3) LINE-1 amplicons containing 5'–methylated and 3'–unmethylated CpGs (mCuC), comprised of 160 bp fragments; and (4) LINE-1 amplicons containing 5'–unmethylated and 3'–methylated CpGs (uCmC), comprised of 18, 62, and 80 bp fragments. The number of CpG dinucleotides can be calculated from the intensity of each band divided by the number of double-stranded bp of DNA sequences as follows: A=160 bp fragment intensity/160; B=98 bp fragment intensity/94; C=80 bp fragment intensity/97; and D=62 bp fragment intensity/62. Finally, the LINE-1 methylation percentage was calculated:
Percentage of total LINE-1 methylation level=100×(C+A)/(C+A+A+B+D)
Percentage of mCuC=100×A/{([C–D+B]/2)+A+D}
Percentage of uCmC=100×(D–B)/{([C–D+B]/2)+A+D}
Percentage of uCuC=100×B/{([C–D+B]/2)+A+D}
Percentage of mCmC=100×([C–D+B]/2)/{([C–D+B]/2)+A+D}
9. Statistical analysis
CU-DREAM software package [25] was used to analyse the gene regulatory functions of intragenic L1s as previously described [1617181925]. Statistical analysis was performed using SPSS ver. 17.0 (SPSS Inc., Chicago, IL, USA). The distributions of analysed characteristics were expressed as the mean±standard deviation. For normal distribution data, an unpaired t-test was used for analysis, and the Mann-Whitney U test was used to analyse the non-normal distribution data. The methylation level was presented as a percentage and was analysed with unpaired and paired t-tests or the Mann-Whitney U test, according to the data. Statistical significance was determined as a p-value ≤0.05 with a 95% confidence interval (CI).
Results
Nineteen and 22 patients were enrolled in the PCOS and normal control groups, respectively. The patient baseline characteristics of the PCOS group and control group are summarised in Table 1. The PCOS and control groups did not statistically differ with regard to age, BMI, and duration of infertility. The baseline hormonal profiles in the PCOS and control groups reveal no statistically significant difference in terms of LH and E2 levels. However, both the antral follicle count (AFC) and the LH/FSH ratio were significantly higher in the PCOS group compared to the normal control group: 14.63 (±4.95) vs. 8.77 (±2.25); p=0.001 and 1.73 (±0.68) vs. 1.31 (±0.47); p=0.021, for AFC and LH/FSH, respectively. In spite of the significantly higher FSH value (IU/L) in the normal control group (5.09 [±2.5] vs. 3.46 [±1.19]; p=0.018), there was no clinical significance.

Baseline demographic data and pretreatment evaluations
The phenotypic profile of PCOS patients were classified as oligo- or anovulation +hyperandrogenism (31.6%), hyperandrogenism+ polycystic ovaries (52.6%), and oligo- or anovulation+hyperandrogenism +polycystic ovaries (15.8%), as presented in Figure 3.

The phenotypic profiles of polycystic ovary syndrome (PCOS) patients.
The ovarian stimulation profiles, including the stimulation period, total gonadotropin used, and numbers of immature oocytes, demonstrated no statistically significant difference between PCOS and normal control groups. However, the peak E2 level, numbers of oocytes retrieved, and numbers of mature oocytes, were significantly higher in the PCOS group (Table 2).
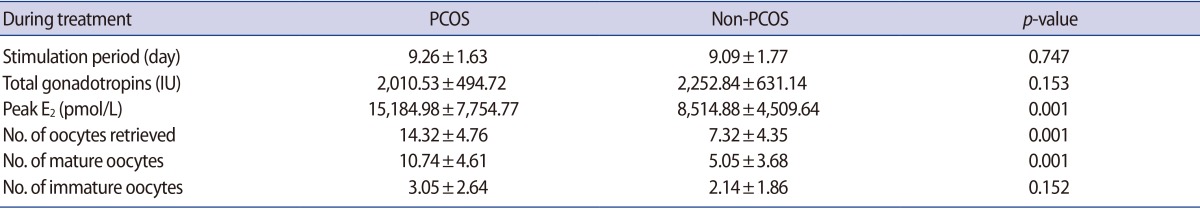
Ovarian stimulation profiles
The CU-DREAM results are shown in two 2×2 table (Table 3). The genes that were upregulated in the experiments were compared with the list of genes containing intragenic L1s. Fourteen genes containing intragenic L1s elements were upregulated in the experiments. In contrast, 335 genes with intragenic L1s elements were not upregulated. Moreover, 81 genes did not contain intragenic L1s but were nevertheless upregulated. The remaining 3579 genes were not significant and did not contain intragenic L1s. The odds ratio (OR) was 1.85 (95% CI, 1.04-3.29) and the p-value was 0.034. Intragenic L1s were downregulated in the experiments, 57 genes that were downregulated did not contain intragenic L1s. In addition, 337 genes contained intragenic L1s but were not downregulated in the experiments, and 3603 genes were not downregulated and did not contain intragenic L1s. The OR of this association was 2.25, (95% CI, 1.20-4.24) and the p-value was 0.009. This result implies that intragenic L1s may serve as regulatory elem (95% CI, 1.20-4.24) and the p-value was 0.009. the percentage of the methylation levels of cumulus cells in mature M II oocytes of both the PCOS and control groups was statistically higher than the percentage of the methylation levels of cumulus cells in immature oocytes (GV or metaphase I oocytes, M I oocytes): 79.14 (±2.66) vs. 70.33 (±4.79) and 75.40 (±4.92) vs. 67.79 (±5.17) in PCOS and control groups, respectively (Figure 4). Moreover, the percentage of the LINE-1 DNA methylation levels was significantly higher in the cumulus cells of mature oocytes in the PCOS group compared to the cumulus cells of mature oocytes in the control group: 79.14 (±2.66) vs. 75.40 (±4.92); p=0.004 (Figure 5A). However, there was no difference between the percentage of the methylation levels in cumulus cells of immature oocytes (GV or M I oocytes) in PCOS and control groups: 70.33 (±4.79) vs. 67.79 (±5.17); p=0.155 (Figure 5B). The correlation between LINE-1 DNA methylation levels and the percentage of top quality oocytes was determined using Spearman's correlation test (Figure 6); no significant correlation between LINE-1 DNA methylation in cumulus cells and the percentage of top quality oocytes was found (correlation coefficient, 0.019; p=0.904).
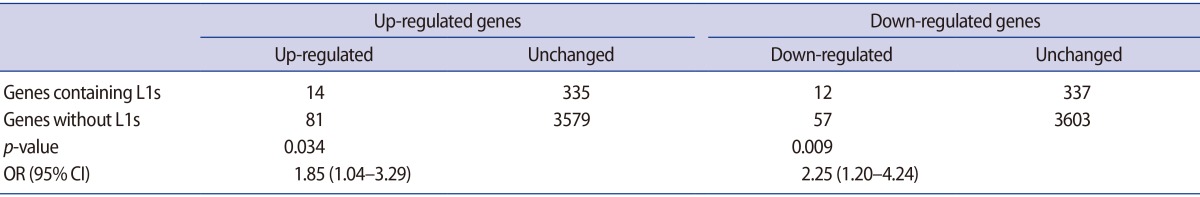
Number of up- or down-regulated genes containing intragenic L1s elements when compared in cumulus cells between PCOS and control
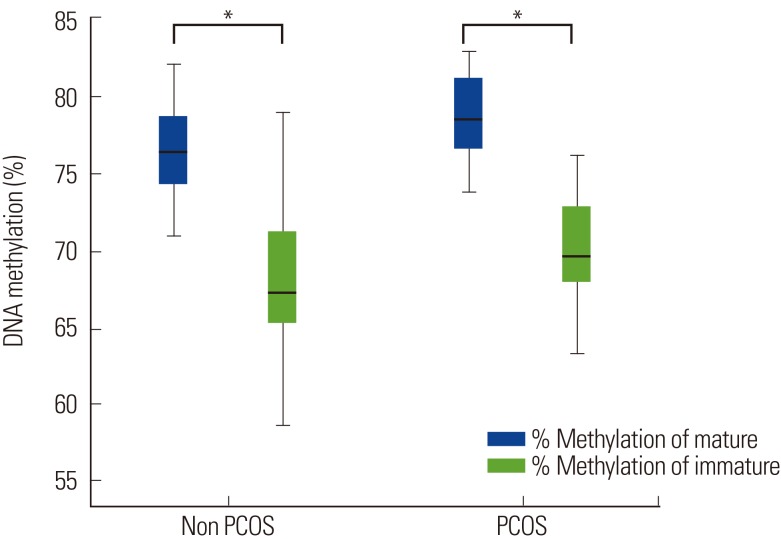
The percentage of long interspersed elements (LINE-1) DNA methylation levels of cumulus cells in mature M (metaphase) II versus immature oocyts. *p=0.001.

The long interspersed elements (LINE-1) DNA methylation levels between control and polycystic ovary syndrome (PCOS). (A) Mature oocytes: the percentage of LINE-1 DNA methylation levels was significantly higher in the cumulus cells of mature oocytes (M II or metaphase 2 oocytes) in the PCOS group compared to the control: 79.14±2.66 vs. 75.40±4.92; *p=0.004. (B) Immature oocytes: there was no difference between the percentage of methylation levels in cumulus cells of immature oocytes (germinal vesicle or M I oocytes) of PCOS and control: 70.33±4.79 vs. 67.79±5.17; p=0.155.
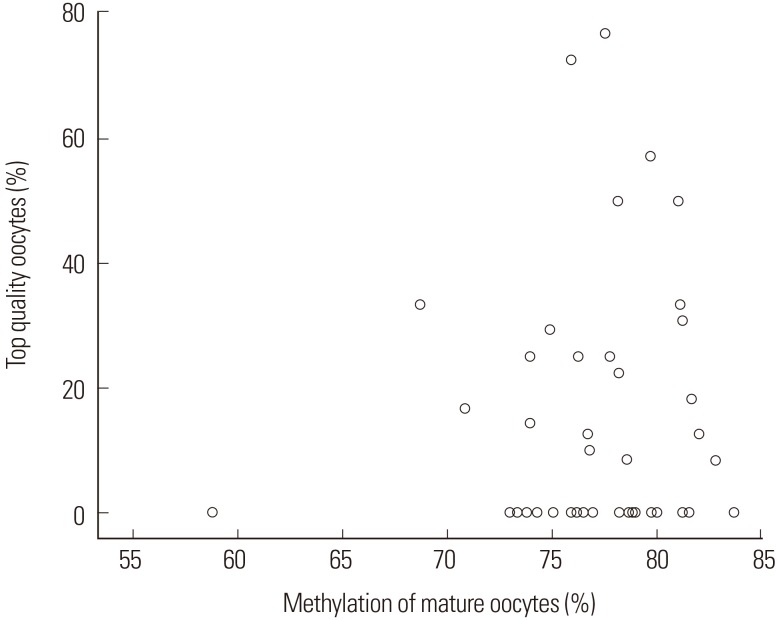
The scatter plot between long interspersed elements (LINE- 1) DNA methylation levels and percentage of top quality oocytes. The correlation between LINE-1 DNA methylation levels and the percentage of top quality oocytes was determined using Spearman's correlation test. There was no significant correlation between LINE-1 DNA methylation in cumulus cells and the percentage of top quality oocytes.
Discussion
This is the first study to investigate epigenetic modification in terms of methylation in cumulus cells of PCOS patients compared to normal controls. We chose to explore and analyse these cumulus cells based on the knowledge that intragenic LINE-1-associated genes are regulated in a tissue-specific manner [16171819]. In addition, cumulus cells are in close contact with the oocyte and have a major role in controlling and regulating metabolism in oocytes. A previous study has shown a significant difference in the gene expression profiles in cumulus cells taken from PCOS and control [5]. Therefore, epigenetic changes that occur in cumulus cells might have an impact on oocyte maturation and play a role in the development of PCOS.
Based on our previous studies, intragenic LINE-1 sequences, which have been conserved over evolutionary time, have a potential role in the regulation of gene expression [16171819]. Therefore, our study, which focuses on methylation changes on LINE-1, one of the two main families of transposable elements, may provide some evidence for epigenetic causes in PCOS etiology.
Previously, we proved that first, intragenic LINE-1 is a regulatory sequence [1419]. Second, changes in genome-wide LINE-1 methylation are generally in the same direction as changes in intragenic LINE-1 methylation [27]. Finally, LINE-1 hypomethylation downregulates genes containing LINE-1 [19]. Here, we found that LINE-1 hypermethylation increases the expression of genes containing LINE-1 in patients with PCOS. Therefore, LINE-1 hypermethylation in PCOS may lead to a PCOS cellular phenotype and clinical symptoms.
Our study reveals that PCOS patients have elevated genome-wide LINE-1 methylation (hypermethylation on LINE-1) in cumulus cells of mature oocytes compared to normal controls. This is in contrast to the study from Xu et al. [20], in which no significant difference in terms of global DNA methylation of peral leukocyte DNA between PCOS and matched controls was found [20]. An explanation could be that our study provides more cell-specificity and site or DNA repeatspecificity in the identification of epigenetic changes in PCOS patients. Methylation changes in DNA repeat-specificity have been reported under several conditions [262728].
Our study shows that the LINE-1 methylation levels in cumulus cells of immature oocytes is not significantly different between PCOS and normal controls. Moreover, no correlation between LINE-1 DNA methylation levels in cumulus cells and the percentage of top quality oocytes was found. These data suggest that environmental factors or hormonal profiles in PCOS patients may affect methylation changes in cumulus cells from immature oocytes, which did not differ between PCOS and normal controls, to mature oocytes, which were significantly different between PCOS and normal controls. Moreover, there was a statistically significant difference in the LINE-1 methylation levels between the cumulus cells of mature and immature oocytes in both PCOS and normal control groups. The maturation of oocytes may be associated with changes in the methylation levels of LINE-1 that control genes containing LINE-1. In PCOS, the change in methylation levels may alter mRNA and cause the pathophysiology of various diseases. Previous studies demonstrated that the intrauterine environment might contribute to the development of PCOS [678] and fetal androgen exposure inside the uterus has been shown to cause epigenetic changes [23]. This finding affirms the role of environmental impact on epigenetic modification and the development of oocytes. The results of this study are consistent with many previous studies, which suggested a role for the environment in epigenetic modification and its associated diseases [212223]. Based on this study, the epigenetic changes in PCOS patients differ from the epigenetic changes in cancer, which shows global hypomethylation [9], thereby implicating different pathophysiologic causes of the associated diseases.
The strength of this study was that the experiment was cell- and site-specific, and the selected population enrolled in the study was controlled for normal BMI, defined age range, and normal oral glucose tolerance test. Based on the knowledge that ageing, hormone-related diseases, obesity, and diabetes might result from epigenetic modification changes [24], this study aimed to avoid all confounding factors that might affect methylation levels.
This study provides the fundamental result that PCOS patients possess epigenetic modification changes compared to normal controls, which might contribute to the pathophysiology and development of the disease. Further studies are required to clarify this information with the aim of targeting treatment to epigenetic changes in PCOS patients using agents such as metformin, hormone modification, and metabolic drugs, and determining the correlation between epigenetic or methylation changes and oocyte quality.
Notes
This project has been funded in whole or in part by a Research Chair Grant from the National Science and Technology Development Agency, Thailand and the Anantara Siam Bangkok Hotel Care for Cancer 2016 Fun Run, in coordination with the Thai Red Cross Society, and the Ratchadaphiseksomphot Fund, Faculty of Medicine, Chulalongkorn University, Bangkok, Thailand.
Conflict of interest: No potential conflict of interest relevant to this article was reported.