Expression of interferon regulatory factor-1 in the mouse cumulus-oocyte complex is negatively related with oocyte maturation
Article information
Abstract
Objective
We found previously that interferon regulatory factor (Irf)-1 is a germinal vesicle (GV)-selective gene that highly expressed in GV as compared to metaphase II oocytes. To our knowledge, the function of Irf-1 in oocytes has yet to be examined. The present study was conducted to determine the relationship between retinoic acid (RA) and RA-mediated expression of Irf-1 and the mouse oocyte maturation.
Methods
Immature cumulus-oocyte-complexes (COCs) were collected from 17-day-old female mice and cultured in vitro for 16 hours in the presence of varying concentrations of RA (0-10 µM). Rate of oocyte maturation and activation was measured. Gene expression was measured by quantitative real-time reverse transcription-polymerase chain reaction (RT-PCR) and cytokine secretion in the medium was measured by Bio-Plex analysis. Apoptosis was analyzed by terminal deoxynucleotidyl transferase dUTP nick end labeling (TUNEL) assay.
Results
The rates of oocyte maturation to metaphase II and oocyte activation increased significantly with RA treatment (10 nM-1 µM). With 100 nM RA treatment, lowest level of Irf-1 mRNA and cumulus cell's apoptosis was found. Among 23 cytokines measured by Bio-Plex system, the substantial changes in secretion of tumor necrosis factor-α, macrophage inflammatory protein-1β, eotaxin and interleukin-12 (p40) from COCs in response to RA were detected.
Conclusion
We concluded that the maturation of oocytes and Irf-1 expression are negatively correlated, and RA enhances the developmental competence of mouse immature oocytes in vitro by suppressing apoptosis of cumulus cells. Using a mouse model, results of the present study provide insights into improved culture conditions for in vitro oocyte maturation and relevant cytokine production and secretion in assisted reproductive technology.
Introduction
Oocyte maturation is a progression of developmental programs that are essential for the production of an oocyte that is competent to undergo fertilization and embryogenesis [1]. There are three different components of oocyte maturation: nuclear, cytoplasmic and epigenetic maturation [2]. Nuclear maturation refers to the resumption of meiosis and progression to metaphase II (MII) [3]. Cytoplasmic maturation includes all of the processes that occur in the cytoplasm, exclusive of meiotic changes in the nucleus, which prepare the oocyte for fertilization and embryo development. Cytoplasmic maturation occurs throughout oocyte growth and is concurrent with nuclear maturation [4]. Epigenetic maturation also occurs during oocyte growth, and refers to sequence-independent modifications of DNA structure that regulate gene expression during oocyte development, oocyte maturation and post-fertilization [5].
Previously, in an effort to better understand the molecular mechanisms involved in the acquisition of oocyte competence, we used annealing control primer-polymerase chain reaction (PCR) to identify differentially expressed genes (DEGs) in the germinal vesicle (GV) and in MII mouse oocytes [6]. Among the DEGs that were identified, interferon regulatory factor (Irf)-1 emerged as a GV-selective gene that was highly expressed in GV as compared to MII oocytes. To our knowledge, the function of Irf-1 as it relates to the meiotic cell cycle and maturation in oocytes has yet to be examined.
Extracellular growth factors that modify Irf-1 expression include common mediators of a variety of biologic processes, including cell cycle progression, DNA damage and apoptosis, cell differentiation, cell-to-cell contact inhibition, and cell senescence. The involvement of Irf-1 in cell cycle regulation and apoptosis has been studied extensively in cells and tissues, and its function as a tumor suppressor can be explained at least in part by its function at the mitotic checkpoint [7].
One of the well-known inducers of Irf-1 is retinoic acid (RA), one of the active forms of vitamin A. Vitamin A plays an essential role in vertebrate physiology, in such processes as cellular growth, development, differentiation, including oocyte maturation [8-11]. The active forms of vitamin A, namely all-trans-RA (atRA) and 9-cis-RA (9cRA), bind to their cognate ligand-activated transcription factors, RA receptor (Rar) and retinoid X receptor (Rxr), each of which exists as one of three isoforms (α, β, and γ). Retinoid signals are reached at the gene level by RAR-RXR heterodimers, which activate or repress specific target genes through binding to specific response elements near promoter regions [12]. The production and secretion of several cytokines, including interferon-γ (IFN-γ), tumor necrosis factor-α (TNF-α), interleukin (IL)-1, IL-2, IL-3, IL-4, and transforming growth factor-β (TGF-β), have been shown to be modulated by RA and RA metabolites in neutrophils, natural killer cells, and T- and B-lymphocytes [13].
It has also been reported that vitamin A supplementation has a positive effect on bovine fertility using artificial reproductive methods, and it has been suggested that RA might promote cytoplasmic maturation of bovine oocytes through the modulation of gene expression in cumulus-granulosa cells [9]. Addition of 9cRA into the IVM medium of bovine cumulus-oocyte-complexes (COCs) increased rates of embryo development and hatching [14].
Since RA and the induction of Irf-1 by RA can establish or change the pattern of gene expression in various cells, we interested in whether these events also influenced the maturation and subsequent capacity of the mouse oocytes to progress through embryonic development. In the current study, we investigated the effects of RA treatment on immature COCs on the oocyte maturation, the expression of many cytokines and genes including Irf-1 and the cumulus cells' apoptosis.
Methods
1. Animals
ICR mice were housed in the breeding facility at the CHA Stem Cell Institute of CHA University (Seoul, Korea) in a temperature-controlled environment under a 12 hours light/12 hours dark cycle. Animals were fed ad libitum. All animal procedures were reviewed and approved by the University of Science Institutional Animal Care and Use Committee, and performed in accordance with the Guiding Principles for the Care and Use of Laboratory Animals.
2. Collection of mouse oocytes, IVM, and oocyte activation
Immature GV stage oocytes were obtained from 17-day-old ICR female mice 44 hours after the injection of 5 IU of pregnant mare serum gonadotropin (PMSG; Folligon, Intervet, Boxmeer, Holland). COCs were collected in M2 medium (Sigma, Louis, MO, USA) containing 0.2 mM 3-isobutyl-1-methyl-xanthine (IBMX; Sigma) to maintain the oocytes at the GV stage. COCs were recovered from the ovaries by puncturing the surface of the ovary, and then cultured at 37℃ in a 5% CO2 incubator in M16 medium (Sigma) containing 3 mg/mL bovine serum albumin (BSA; Sigma) and increasing concentrations (0 nM, 10 nM, 100 nM, 1 µM, 10 µM) of RA, as indicated. The vehicle solution was 0.01% ethanol. After 16 hours in culture, oocytes were denuded and examined using a stereomicroscope to determine maturation stage. Emission of the first polar body was used as an indicator of progression to MII. Oocytes without GVs or polar bodies were scored as MI. Isolated oocytes, remnant cumulus cells and culture medium were snap-frozen and stored at -70℃.
To determine cytoplasmic maturation status, oocytes were parthenogenetically activated by incubation in activating medium (Ca2+-free CZB supplemented with 10 mM SrCl2 [Sigma] containing 5 µg/mL cytochalasin B [Sigma]) at 37℃ in a humidified atmosphere of 5% CO2. 6 hours after the onset of activation, oocytes were examined by microscopy.
3. RNA isolation and reverse transcription (RT)-PCR
Messenger RNA (mRNA) was isolated from the same number of oocytes and cumulus cells (derived from the same COCs) using a Dynabeads mRNA Direct Kit (Dynal, Oslo, Norway), according to the manufacturer's instructions. Cells were resuspended in lysis/binding buffer (containing lithium dodecylsulphate/lithium chloride) for 5 minutes at room temperature, and then the solution was incubated with Dynabeads oligo (dT)25 at room temperature for 5 minutes to separate mRNA from total RNA. Bound mRNA was immobilized against the wall of a microfuge tube using a magnet (Dynal MPC-S; DYNAL A.S, Oslo, Norway), and the supernatant was removed. Dynabead/mRNA complexes were washed twice with lysis buffer and then three times with washing buffer. The complexes were resuspended in 10 µL of Tris-HCl (10 mM Tris-HCl, pH 7.5) at 65℃ for 2 minutes, and then an aliquot was used for reverse transcription.
PCR was carried out in a reaction mixture consisting of 20 mM Tris-HCl (pH 8.4), 50 mM KCl, 2.5 mM MgCl2, 0.2 mM dNTPs, 25 pmol of each primer, and 2.5 U of Taq DNA polymerase (Promega, Madison, WI, USA) in a final volume of 20 µL. Amplified products (20 µL) were separated by 1.2% agarose gel electrophoresis and assessed using an Image Analyzer (Viber Lourmat). The sequences of the gene-specific primers (β-Actin was used as an internal control), as well as the PCR conditions, are listed in Table 1.
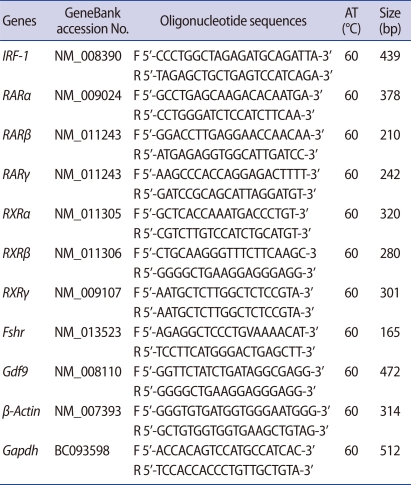
Sequences of oligonucleotide primers, annealing temperatures (AT) and expected reverse transcription-polymerase chain reaction product sizes
4. Quantitative real-time RT-PCR
Quantitative real-time RT-PCR analysis was also accomplished as described previously [15]. Quantitative real-time RT-PCR analysis was performed using an iCycler system (Bio-Rad, Hercules, CA, USA) and the results were evaluated using iCycler iQ real-time detection system software. The template was amplified by 40 cycles of denaturation at 95℃ for 40 second, annealing at 60℃ for 40 second, and extension at 72℃ for 40 second. At the completion of the PCR, we monitored fluorescence continuously while slowly heating the samples from 60℃ to 95℃ at 0.5℃ intervals, producing melting curves to identify any nonspecific products. Gene amplification was quantified by determining the cycle threshold (CT), based on the level of fluorescence within the geometric region of the semilog amplification plot. The mRNA level of each target gene was calculated using the comparative CT method, and the experiments were repeated at least three times using different sets of oocytes and cumulus cells.
5. Terminal deoxynucleotidyl transferase dUTP nick end labeling (TUNEL) assay
All COCs, including the control and treatment groups, were washed in PVP (1 mg/mL polyvinyl-pyrolidone in phosphate buffered saline) and then fixed in a solution of 3.7% paraformaldehyde (w/v) and 0.2% Triton X-100 for 40 minutes at room temperature. The fixed COCs were washed twice in PVP and then incubated in 0.5% Triton X-100 for 1 hour at room temperature. The samples were then incubated for 1 hour at 37℃ in TUNEL reaction mixture (In situ Cell Death Detection Kit, Roche, Mannheim, Germany). After the TUNEL reaction was completed, nuclei were stained with Hoechst 33342 (2 µg/mL) for 30 minutes, and the COCs were mounted on slides using Vectashield mounting medium (Vector Laboratories Inc., Burlingame, CA, USA). Slides were observed by a laser-scanning confocal microscopy (LSM 510, Carl Zeiss, Dublin, CA, USA). Simulated 3D images and sections were constructed using the software Volocity (PerkinElmer, Waltham, MA, USA).
6. Bio-Plex analysis
Changes in the amounts of cytokines in culture media during IVM were measured using the Bio-Plex 2200 system (Bio-Rad). The Bio-Plex filter plate was pre-wet with buffer prior to the addition of samples. Antibody-coupled beads for 23 different cytokines (IL-1a, IL1b, IL-2, IL-3, IL-4, IL-5,IL-6, IL-9, IL-10, IL-12 [p40], IL-12 [p70], IL-13, IL-17, G-CSF, GM-CSF, INF-γ, KC, macrophage inflammatory protein [MIP]-1α, RANRES, TNF-α, eotaxin, MCP-1, and MIP-1β) were premixed (06-0143; Bio-Rad), and assays were carried out according to the manufacturer's protocol. After loading of the bead solutions and samples, the plate was incubated for 30 minutes at room temperature with shaking. After washing three times, detection antibodies were added and the plate was incubated for 30 minutes, followed by the addition of streptavidin-PE for 10 minutes. The plate was agitated to resuspend the beads, and the amount of cytokine was measured using the Bio-Plex 2200 system. Each reaction was carried out in duplicate and the experiment was repeated three times.
7. Statistical analysis
All statistical analyses were performed on a CHA University mainframe computer using the Statistical Analysis System (SAS; SAS Korea Inc., Seoul, Korea), version Enterprise 4.0. At least three independent experiments were conducted for each treatment condition. The rate of maturation, oocyte activation, the rate of apoptosis and cytokine levels were evaluated using a mixed model analysis of variance procedure (PROC MIXED; SAS) followed by Fisher's least significant difference. Data are expressed as mean±SE, and a p-value of <0.05 was considered significant.
Results
1. Characterization of Irf-1 and RAR expression
Expression of Irf-1 mRNA was analyzed by quantitative real-time PCR (Figure 1A). Irf-1 was highly expressed in GV oocytes as compared to MII oocytes. In each case of melting curve, there was a single peak that indicated the absence of nonspecific amplicons (inset, Figure. 1A). Irf-1 mRNA was ubiquitously expressed in ovarian follicular cells (Figure 1B).
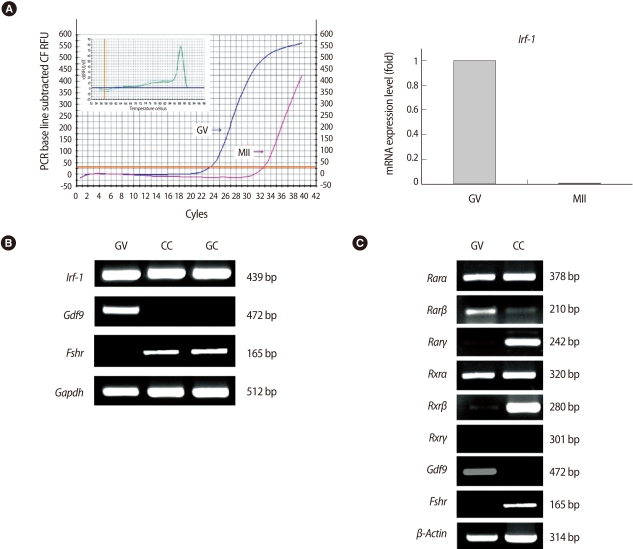
Levels of interferon regulatory factor (Irf)-1 and retinoic acid (RA) receptor mRNA. (A) Quantitative real-time reverse transcription-polymerase chain reaction (RT-PCR) analysis of Irf-1 mRNA expression in germinal vesicle (GV) and metaphase II (MII) mouse oocytes. The cDNA equivalent of a single oocyte was used as the template for amplification. Left side, line graph shows the difference of CT values between GV and MII oocytes and right side, bar graph shows expression levels calculated using its CT value. (B) Analysis of Irf-1 mRNA level in mouse follicular cells using RT-PCR. (C) Levels of Rarα, Rarβ, Rarγ, Rxrα, Rxrβ, Rxrγ, Gdf9, Fshr, and β-Actin mRNA transcripts. Gdf9 mRNA was used as a specific marker for oocytes, and Fshr was used as a marker for cumulus and granulosa cells. GV, GV oocytes; CC, cumulus cells; GC, granulosa cells, Gdf9, growth differentiation factor; Fshr, follicle stimulating hormone receptor; Gapdh, glyderaldehyde 3-phosphate dehydrogenase; Rar, retinoic acid receptor; Rxr, retinoid X receptor.
Rarα and Rxrα mRNAs were expressed in both oocytes and cumulus cells. Rarγ and Rxrβ were highly expressed in cumulus cells as compared to oocytes, while the expression of Rxrγ was not detected in oocytes or cumulus cells (Figure 1C). Growth differentiation factor 9 (Gdf9) and FSH receptor (Fshr) expression was measured as an indicator for clear cell separation between oocytes and granulosa cells.
2. The effect of RA on nuclear and cytoplasmic maturation in vitro
To examine the effects of RA on the maturation of mouse oocytes, Immature COCs from 17-day-old mice were incubated with 0, 10 nM, 100 nM, 1 µM and 10 µM RA as summarized in Figure 2. As a control for the effect of the vehicle solution, COCs were treated with 0.1% ethanol alone. The maturation rates of the control and vehicle groups were 79.6% and 75.2%, respectively. The rate of maturation to MII was highest in the presence of 100 nM RA (91.9%), and maturation rates of the 10 nM and 1 µM groups were comparable as 86.9% and 85.4% (Figure 3A).
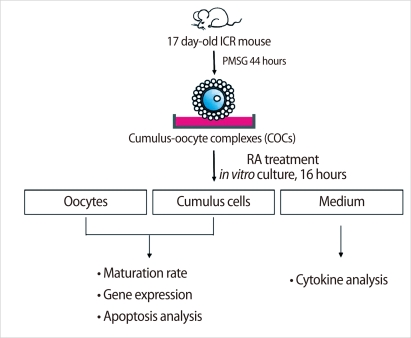
Schematic diagram of the experimental strategy for evaluating the effects of retinoic acid (RA) on the oocyte maturation in mouse. Cumulus-oocyte-complexes (COCs) from preovulatory follicles were collected from the ovaries of 17 day-old mice 44 hours after PMSG injection. COCs were incubated with various doses (0-10 µM) of RA. At the end of culture period for 16 hours, the oocytes were denuded and examined using a stereomicroscope to determine the progression of meiotic maturation. PMSG, pregnant mare serum gonadotropin; Oocyte, cumulus cells, and conditioned medium were sampled and snap frozen for further analysis.
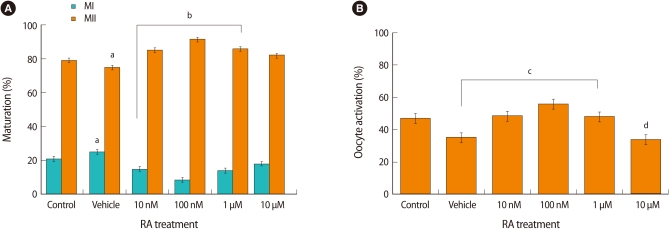
The effect of retinoic acid (RA) treatment on the oocyte maturation in vitro. (A) The effect of RA on nuclear maturation. Mouse cumulus-oocyte-complexes (COCs) obtained from 17-day-old mice were incubated with increasing doses of RA. The oocytes were then denuded, and examined using a stereomicroscope to score the progression of meiotic maturation. Emission of the first polar body was used as an indicator of progression to metaphase II (MII). Oocytes without germinal vesicle (GV) or polar bodies were scored as metaphase I (MI). Data represents the means±SE of at least three experiments. Letter a, indicates that group means were significantly different from the control group. Letter b, indicates that the conditions, 10 nM, 100 nM, and 1 µM are significantly different from the control group for both MI and MII (p<0.001). (B) The effect of RA on cytoplasmic maturation. Activation of IVM mouse oocytes after treatment with RA was measured. Six hours after the onset of activation, oocytes were observed under a microscope. Oocytes with pronuclei, or two cells with each one nucleus, were considered activated. Data represents the mean±SE of at least three experiments. Letter c, indicates that group means were significantly different from the vehicle group (p<0.05). Letter d, indicates that the 10 µM group is significantly different from the all other groups except for the vehicle group (p<0.06).
The oocyte activation rate was also highest in the presence of 100 nM RA (56%), as compared to control (46.89%) and vehicle (34.91%) groups (Figure 3B). Post hoc analysis showed that the vehicle group was significantly different from the three conditioned group including 10 nM, 100 nM, and 1 µM (p<0.03). The 10 µM group differed significantly from all the other groups with the exception of the vehicle group (p<0.06).
3. The effect of RA on Irf-1 mRNA and cytokine expression
To determine the effect of RA on Irf-1 mRNA expression, we performed quantitative real-time PCR analysis using cDNA from separated oocytes and cumulus cells. In oocytes, Irf-1 mRNA expression was markedly decreased by 100 nM (Figure 4A), as compared to that of control. There were significant differences in mRNA expression levels between 100 nM and all the other groups. The mRNA expression level of the 10 µM group was about twice as much as the control group. In cumulus cells, the pattern of expression of Irf-1 mRNA was similar to that of oocytes, but the fold changes were much larger than in oocytes (Figure 4B). As shown in Figure 4B, the control group expressed the lowest level of mRNA among six groups (p<0.002). Contrast analyses showed there were significant differences in mRNA expression level between control group and all the other groups with exception of 100 nM group (p<0.02).
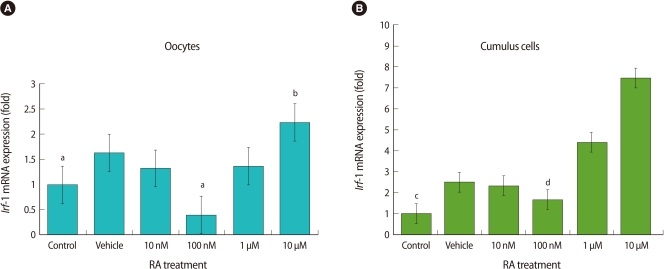
The effect of retinoic acid (RA) on interferon regulatory factor (Irf)-1 mRNA expression in oocytes (A) and cumulus cells (B). Data represents the means±SE of at least three experiments. (A) Letter a, indicates that 100 nM is significantly different from all other groups except for the control group. Letter b, indicates that the 10 µM group is significantly different from the control and 100 nM groups p<0.05). (B) Letter c, indicates that control group is significantly different from all other groups except for the 100 nM group (p<0.05); while letter d, indicates 100 nM group is significantly different from all other groups except for the control group.
We examined the expression levels of 23 cytokines in culture medium using Bio-Plex system and detected substantial changes in the expression of 4 cytokines, such as TNF-α, MIP-1b, eotaxin and IL-12 (p40) in the presence of RA. The secretion profiles of these four cytokines are summarized in Figure 5.

The secretion of tumor necrosis factor (TNF)-α, macrophage inflammatory protein (MIP)-1b, eotaxin and interlukin-12 (p40) after in vitro culture of cumulus-oocyte-complexes (COCs) with increasing doses of retinoic acid (RA). After a 16 hours incubation period, the culture medium was collected and assayed using the Bio-Plex assay system. Data represents the mean±SE of at least three experiments. For TNF-α, letter a, indicates that the 100 nM is significantly different from all these groups (p<0.05). Letter b, indicates that the 10 µM group is significantly different from all groups except 1 µM groups (p<0.0004). For MIP-1b, letter c, indicates that the 10 nM is significantly different from all other groups except for 10 µM groups (p<0.05). Letter d, indicates that the 10 µM group is significantly different from the all other groups except for the 10 nM group (p<0.001). For eotaxin and IL-12 (p40), the control group is significantly different from all other groups (e and f, p<0.001).
In the case of TNF-α, the 100 nM group showed the lowest level among six groups with the highest level in 10 µM group. The level of TNF-α of 100 nM was significantly less than those of 10 nM and 1 µM (p<0.05). There was significant group difference in the MIP-1b level (p<0.004). The 10 µM group exhibited the highest level of MIP-1b with a significant difference compared to all the other groups. The level of eotaxin and IL-12 in the control group was significantly higher than those in any other conditioned groups (p<0.001). Results clearly showed that all the conditions decrease the level of eotaxin and IL-12 in comparison to control group.
4. The effect of RA on apoptosis in CCs
To determine the effect of RA on apoptosis of COCs, we performed the TUNEL assay. A representative result, showing red-stained apoptotic cells, is shown in Figure 6A. The rate of COC apoptosis was lowest in the presence of 100 nM RA (20.86%), and this was significantly lower than that of the control (43%) or vehicle (43.02%) groups. The rates of apoptosis increased significantly in the presence of 1 µM and 10 µM RA (57.33% and 76.17%, respectively, Figure 6B).
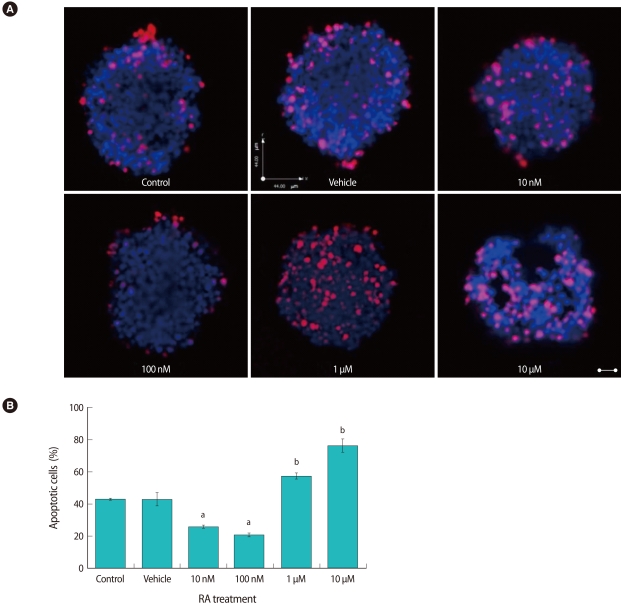
The effect of retinoic acid (RA) treatment on apoptosis of cumulus cells. (A) Representative pictures of terminal deoxynucleotidyl transferase dUTP nick end labeling (TUNEL) assay showing cumulus-oocyte-complexes (COCs) after IVM in the presence of increasing doses of RA. The red color indicates DNA fragmentation. COCs were counter stained with Hoechst 33342 (blue). (B) The apoptotic rate was calculated as the number of cells with positive TUNEL staining (red) divided by the number of cells with positive Hoechst staining (blue). Letters a and b, indicate that the group mean was significantly decreased and increased, respectively, than that of the control cells (p<0.05). Scale bar indicates 25 µm.
Discussion
In the current study, we demonstrated that 1) RA treatment of immature COCs in vitro has a beneficial effect on increasing oocyte maturation rates; 2) RA may reduce cumulus cell apoptosis through the reduction of Irf-1 expression and destructive cytokine secretion from oocytes, in particular from cumulus cells; and 3) these changes may be favorable for producing high quality oocytes.
Retinoid, in particular RA, can induce differentiation in a number of cells, and plays a role in the regulation of the cell cycle [16]. However, while RA can induce or silence the expression of hundreds of genes, little is known about the molecular mechanism of action of RA within intact tissues [17,18]. In the current study, treatment of immature COCs with RA during IVM, especially at 100 nM concentration, improved both nuclear and cytoplasmic oocyte maturation with lowest apoptosis in cumulus cells.
Ovarian follicular cells are regulated through a variety of mechanisms that involve the action and interactions of endocrine, paracrine and autocrine factors. To date, gene expression studies of Rar and Rxr family have not focused on ovarian follicular cells, including oocytes. In the current study, we investigated the role of RA during spontaneous IVM, and characterized the expression patterns of RARs and RXRs in ovarian follicular cells. Retinoids function through the RAR and RXR families of transcription factors, each of which is comprised of multiple isotypes (α, β, γ). RAR and RXR form heterodimers (RAR-RXR) that function in transmitting RA signals [19]. Previous studies have shown that Rxrα and Rxrβ are ubiquitously expressed in the mouse embryo during development, whereas Rxrγ exhibits a restricted pattern of expression during embryogenesis [20]. We found that Rxrα and Rxrβ, not Rxrγ, are present in ovarian follicles. The expression of RAR and RXR family transcription factors in ovarian follicles suggests that certain receptor isoforms might function in RA signaling during oocyte maturation, fertilization and embryo development. RXRγ, however, does not appear to be involved in these processes.
IRF-1 is a regulator of the cell cycle and apoptosis, and inactivation of IRF-1 accelerates the process of cellular transformation. IRF-1 functions as a transcription factor to induce genes involved in strengthening immune responses and promoting cancer prevention [21]. BRCA1-induced IRF-1 nuclear localization and its transcriptional activity activate a multi-component network containing OAS-2 and RNase L [22]. TNF-related apoptosis inducing ligand (TRAIL) and other IRF-1 responsive genes may function in concert to induce apoptosis in cancer cells. The tumor suppressor functions of RNase L can also amplify the apoptotic signals generated by TRAIL [23]. At a concentration of 10-100 nM, RA significantly reduced the rate of apoptosis of cumulus cells. Cumulus cells undergo apoptosis during IVM, and it has been proposed that there is a negative correlation between the degree of cumulus cell apoptosis during IVM and the developmental competence of COCs [24].
A complex array of regulatory factors, including hormones, cytokines and growth factors, influence oocyte viability and development potential, either directly or indirectly [25,26]. Cytokines, in particular, play an important role in the regulation of ovarian function, gonadal steroid secretion, corpus luteum function, embryonic development and implantation. To our knowledge, this is the first report of the simultaneous measurement of multiple cytokines from a single COC culture after treatment with RA during oocyte maturation. Using the Bio-Plex system, which is a bead-based ELISA, the levels of 23 cytokines were assessed. A substantial level and regular pattern of secretion was detected for 4 of the 23 cytokines examined, namely TNF-α, MIP-1b, eotaxin and IL-12 (p40).
TNF-α is a 14 kDa pleiotropic cytokine produced by several cell types, particularly the macrophage [27]. During oocyte maturation, TNF-α compromises oocyte developmental potential and increases blastomere apoptosis, resulting in reduced embryo survival [28]. MIP-1b is an 8 kDa member of the CC chemokine family, and is synthesized by a variety of cells, including monocytes and activated T- and B-cells [29]. TNF-α and MIP-1b levels were decreased by treatment with 100 nM RA, and this decrease correlated with decreased Irf-1 expression. These results suggest a close functional relationship between the regulation of Irf-1 expression and the secretion of TNF-α and MIP-1b.
Eotaxin is an 8.3 kDa protein that also belongs to the CC family of chemokines. It acts through CC chemokine receptor 3 (CCR3) on eosinophils [30]. The accumulation of eosinophils within human tissue has been correlated with increased eotaxin expression in a number of inflammatory conditions, including atopic asthma, nasal polyps and ulcerative colitis [30]. IL-12 is a pleiotropic type 1 cytokine that mediates several biological activities in human T-cells and natural killer (NK) cells, including the induction of INFγ production and the enhancement of cell mediated cytotoxicity [31]. The presence of IL-12 in follicular fluid is associated with a negative outcome during IVF, which could reflect the immaturity of follicles as well as the negative effect of IL-12 on folliculogenesis, oocyte maturation and implantation [32]. Eotaxin and IL-12 (p40) were decreased by all doses of RA examined, as compared to control cells, suggesting that RA has some positive effect of the induction of oocyte maturation in vitro by inhibiting these cytokines.
In the present study, while the dose of 100 nM RA treatment showed consistent results, dose of 10 nM or 1 µM showed incompatible fluctuating results fatefully. Therefore even though the maturation and activation rate was increased from 10 nM to 1 µM RA treatment (Figure 3), we advocate 100 nM treatment for maintain steadiness of the culture system.
In conclusion, RA enhanced the developmental competence of mouse oocytes through the suppression of apoptosis in the mouse COCs, oocytes as well as cumulus cells, during IVM. We also presented evidence that RA promotes the cytoplasmic maturation and viability of mouse oocytes through the modulation of Irf-1 gene expression in cumulus cells and oocytes. The production and secretion of several cytokines was also modulated by RA during oocyte maturation, and the secretion pattern of TNF-α and MIP-1b strongly suggests a functional relationship between these cytokines and RA through Irf-1.
Notes
This study was supported by a grant of the Korea Healthcare Technology R&D Project, Ministry for Health, Welfare & Family Affairs, Republic of Korea (A084923).
No potential conflict of interest relevant to this article was reported.