Metabolomic profiling of embryo culture media in patients with repeated implantation failure during assisted reproductive technology cycles
Article information

Abstract
Objective
This study investigated the metabolic status of the spent culture media from embryos of patients with repeated implantation failure (RIF) undergoing in vitro fertilization–intracytoplasmic sperm injection cycles in comparison with the embryos from healthy fertile women.
Methods
Metabolite levels in spent culture media were assessed and compared between embryos from RIF patients (n=35) and oocyte donors as controls (n=15). Protein levels of insulin-like growth factor 1 (IGF-1) were determined using Western blotting. Concentrations of glucose, pyruvate, and lactate were measured using spectrophotometry. Ionic colorimetric assay kits were utilized to analyze the concentrations of sodium, chloride, calcium, and magnesium ions. High-performance liquid chromatography was employed to measure the concentrations of glutamic acid, aspartic acid, methionine, phenylalanine, and histidine.
Results
Glucose consumption and lactate secretion were higher in the control group than in the RIF group. The magnesium concentration was significantly higher in the control group than in the RIF group, but glutamic acid and aspartic acid concentrations were lower in the control group than in the RIF patients (p<0.05). The levels of IGF-1, sodium, calcium, chloride, methionine, histidine, and phenylalanine did not show statistically significant differences between the two groups.
Conclusion
The metabolic profile of the culture medium of the embryos in the RIF group differed from that of the control group. These findings suggest potential factors that may affect implantation capacity in RIF patients and provide a new perspective on embryo selection.
Introduction
Despite rapid advances in assisted reproductive technology (ART), the implantation rate remains suboptimal [1]. Many couples undergoing ART cycles continue to experience repeated implantation failure (RIF) [2], which is one of the most widely challenging problems at infertility centers. RIF is defined as the inability to achieve clinical pregnancy after a minimum of three in vitro fertilization (IVF) or intracytoplasmic sperm injection (ICSI) cycles, involving the transfer of at least six high-quality embryos [3-5]. Various factors have been proposed as potential causes of implantation failure, including embryo-related factors and poor endometrial receptivity [3,5,6].
The selection of high-quality embryos is an important part of the strategy for managing RIF patients [2,7]. Improvement in embryo selection methods directly contributes to increased pregnancy rates [8]. However, the current standard for embryo selection primarily relies on the morphological appearance, such as the presence of several cells and speed of cleavage divisions, level of fragmentation and vacuolation, and the blastomeres' shape and size. However, research has shown that this approach is far from perfect, with embryo implantation rates ranging from 20% to 40% [7].
The evaluation of metabolomic profiles in the embryo culture medium has emerged as an effective method for predicting embryo viability and developmental potential [9]. Metabolomics involves comprehensive analyses of interactions between various small molecules or biomarkers, known as metabolites, including amino acids, lipids, nucleotides, and signaling molecules [10,11].
Several metabolic parameters associated with the culture medium of developing embryos have been investigated. For instance, Gardner et al. [12] reported higher glucose uptake in high-quality human blastocysts, while Brison et al. [13] found that higher asparagine levels and lower glycine and leucine levels in the culture medium were directly linked to pregnancy. In a study focusing on identifying metabolites impacting embryo implantation, the culture medium of embryos with positive and negative implantation outcomes was compared using electrospray ionization mass spectrometry. Specific biochemical markers were discovered in the culture medium of successfully implanted embryos, demonstrating the potential for predicting the implantation potential of human embryos [14]. Another study examining the metabolomic profile of culture medium from thawed embryos revealed that the characteristics of the medium were independent of embryo morphology and correlated with the embryo's implantation potential in frozen-thawed embryo transfer cycles [15]. These studies indicate that the embryonic culture environment is influenced by the embryo's reproductive potential and underscore the importance of identifying key metabolites to predict embryos with high implantation potential, offering new possibilities for successful pregnancies in patients experiencing RIF [9].
To the best of our knowledge, no previous investigations have explored metabolites of day 3 embryos in subjects with RIF. Hence, this study aimed to evaluate and compare the metabolomic profiles of spent embryo culture medium between individuals with unexplained RIF and healthy individuals with successful pregnancies.
Methods
1. Study design
This study received approval from the Ethical Committee of the Iran University of Medical Sciences (number: IR.Iums.fMD.REC.1398.149). Written informed consent was obtained from all participants. The study included 35 patients with unexplained RIF, defined as the failure to achieve implantation after at least four good-quality embryo transfers in three consecutive embryo transfer cycles. The control group consisted of 15 oocyte donors with proven fertility, having at least one live birth following a natural pregnancy. In the RIF group, participants were excluded if they had any identifiable causes such as polycystic ovary syndrome, ovarian tumors, autoimmune disorders, chromosomal anomalies, sexually transmitted diseases, polyps, fibroids, endometriosis, adenomyosis and malformation of the uterus. All subjects had a range in age from 18 to 38 years, and a body mass index below 30 kg/m2. None of the participants had any pre-existing medical conditions or abnormalities. Both groups met the inclusion criteria of regular menstrual cycles, a normal uterine cavity, an endometrial thickness of 7 mm or greater in ultrasound, normoresponsiveness to the stimulation protocol, and the absence of intrauterine adhesions or inflammation. They also had regular serum levels of follicle-stimulating hormone, estrogen, progesterone, and thyroid-stimulating hormone. The male partners of the couples had normal semen analysis results according to the World Health Organization guidelines [16]. Ovarian stimulation was initiated using a standard antagonist protocol for both groups. Oocytes were retrieved 36 hours after human chorionic gonadotropin administration, and mature oocytes at the metaphase II stage were subjected to an ICSI procedure. Subsequently, the embryos were cultured in SAGE 1-Step medium (Origio media) under controlled conditions of 6% CO2, 5% O2, and 37 °C [17]. Fertilization was assessed 16 to 18 hours after ICSI by observing the presence of two pronuclei, and embryo development was monitored until the third day [18]. Finally, the spent embryo culture medium was stored at –80 °C for experiments. During the embryo culture process, the drops of the culture medium were 50 mL, with four embryos cultured in each drop. Each drop served as a sample for analysis. Ultimately, the samples were pooled together, and three samples were analyzed for each group. Different volumes ranging from 10 to 20 mL were used for each analysis.
2. Protein extraction and Western blot analysis
The protease inhibitor cocktail was sourced from Roche. Polyvinylidene difluoride membranes were from Millipore, while enhanced chemiluminescence (ECL) reagents were from Amersham Pharmacia Corp. All other reagents were acquired from Sigma Aldrich. To experiment, 20 to 30 μg of total protein was separated by sodium dodecyl sulfate–polyacrylamide gel electrophoresis (SDS-PAGE) and subjected to immunoblotting using an anti-insulin-like growth factor 1 (IGF-1) antibody (Elabscience). The protein concentration of all samples was determined using a Bradford assay (Sigma Aldrich) with bovine serum albumin as the standard. Total proteins were then separated by 8% SDS-PAGE and transferred onto a polyvinylidene difluoride membrane (Sigma Aldrich).
For membrane blocking, a solution containing 0.1% Tween 20 in Tris-buffered saline with 2% skim milk was used for 75 minutes. The membranes were then incubated overnight with a 1:300 dilutions of anti-IGF-1 polyclonal antibody (Elabscience), followed by incubation with a 1:1,000 dilution of mouse anti-rabbit immunoglobulin G (IgG)-horseradish peroxidase (HRP) antibody (Santa Cruz Biotechnology Inc.) for 75 minutes. Immunoblotted protein bands were visualized using ECL, and the protein bands were quantified using gel-analyzer version 2010a software (National Institutes of Health), relative to the internal reference [19]. The glyceraldehyde 3-phosphate dehydrogenase (GAPDH) housekeeping gene was used for normalization.
3. Metabolome analysis
1) Glucose concentration assay
Glucose content was determined using a glucose colorimetric assay kit (Pars Azmun). In this experiment, the exposure of glucose to glucose oxidase leads to the production of H2O2, which is the substrate of peroxidase, which subsequently converts 4-aminoantipyrine to quinoneimine. The amount of quinoneimine is proportional to the glucose concentration.
The assay was performed by incubating a mixture of 10 μL of diethyl pyrocarbonate (DEPC)-treated water, 10 μL of embryo culture medium or standard samples, and 1,000 μL of glucose assay reagent (250 mmol/L phosphate=buffer, 5 mmol/L phenol, 0.5 mmol/L 4-aminoantipyrine, 10 KU/L glucose oxidase, 1 KU/L peroxidase) for 20 minutes at 20 to 25 °C. The absorbance of the standards and samples was then measured at a wavelength of 546 nm (UV-2600i/2700i; Shimadzu Corp.), relative to the blank. The cuvette used in this experiment had a path length of 1 cm.
2) Lactate concentration assay
To measure the amount of lactate, a lactate assay kit was used (ZellBio Gmbh). In this experiment, lactate oxidase catalyzed the conversion of lactate into pyruvate and H2O2. The presence of peroxidase facilitated the reaction between hydrogen peroxide, 4-aminoantipyrine, and 2,4,6-tribromo-3-hydroxybenzoic acid (TBHB), resulting in the formation of a red substance, chinonimine, the concentration of which was directly proportional to the lactate amount.
For the assay, 10 μL of samples and standards were mixed with 1,000 μL of lactate assay reagent R1, which contained 150 mmol/L Tris buffer (pH 7.5), >30 KU/L lactate oxidase, >1 KU/L peroxidase, 0.3 mmol/L 4-aminoantipyrine, and 2.5 mmol/L TBHB. The mixture was then incubated at 37 °C for 10 minutes. The absorbance of the samples was measured at a wavelength of 546 nm using a cuvette with a path length of 1 cm.
3) Pyruvate concentration assay
The pyruvate content in the study samples was measured using a pyruvate assay kit (MAK071; Sigma Aldrich). A mixture of 46 μL of pyruvate assay buffer, 2 μL of pyruvate probe solution, and 2 μL of pyruvate enzyme mix was prepared and incubated for 30 minutes at 37 °C. The absorbance of all samples was then analyzed at a wavelength of 546 nm using a cuvette with a path length of 1 cm.
4. Inorganic ion consumption determination
For the measurement of ionic concentrations in all samples, a two-solution method employing two ion assay reagents was utilized. Reagent 1 comprised 0.8 mol/L ethanolamine and detergent with a pH of 10.7. Reagent 2 consisted of 0.06 mmol/L 2-cresolphthalein, 7 mmol/L 8-hydroxyquinoline, and 20 mM HCl with a pH of 1.1. During the experiment, a purple complex formed as a result of the reaction between the ion and cresolphthalein complexone in an alkaline environment. The concentration of this complex was directly proportional to the corresponding ion concentration. Initially, a mixture of 20 μL of sample, 20 μL of DEPC-treated water, and 1,000 μL of reagent 1 was prepared and incubated at room temperature for 5 to 30 minutes. The absorbance of the mixture was then measured at 570 nm. Subsequently, 250 μL of reagent 2 was added to the aforementioned mixture. After re-incubation of the sample for an additional 5 to 30 minutes, the absorbance was determined again at 570 nm. Calcium, sodium, magnesium, and chloride ions were analyzed separately using an inorganic ion assay kit (Pars Azmun). This kit was designed to measure ions within the range of 0.2 to 20 mg/dL. Additionally, a cuvette with a path length of 1 cm was used in this experiment.
5. High-performance liquid chromatography
In this study, the concentration of histidine, methionine, phenylalanine, glutamic acid, and aspartic acid in the embryo culture medium of the RIF and control groups was determined using high-performance liquid chromatography (HPLC). A Zorbax AAA column (150 mm×4.6 mm, Agilent 1100; Agilent) and a fluorescence detector were used to quantify the amino acids. Mobile phase 1 was 10 mM sodium dihydrogen phosphate and ethanol with a pH of 7.2 (80:20, v/v), while mobile phase 2 comprised 10 mM sodium dihydrogen phosphate buffer and ethanol with a pH of 7.2 (50:50, v/v). The absorption of amino acids was measured at an excitation wavelength of 340 nm and an emission wavelength of 450 nm at a temperature of 40 °C. The amount of amino acids was determined based on the area under the curve using their respective standard curves [20].
6. Statistical analysis
Data analysis was performed using SPSS version 24.0 (IBM Co.) and Prism 8 software (GraphPad Software Inc.). All data were reported as mean±standard deviation. A p<0.05 was considered to indicate statistical significance. The normality of the data was assessed with the Kolmogorov-Smirnov test, and if the data were normally distributed, the independent sample t-test was used. If the data were not normally distributed, the nonparametric Mann-Whitney test was employed.
7. Availability of data and material
The data that support the findings of this study are available from the corresponding author upon reasonable request.
Results
1. Study population
Demographic and clinical data of study groups are summarized in Table 1. Data analysis showed no significant difference between the two groups (p>0.05).
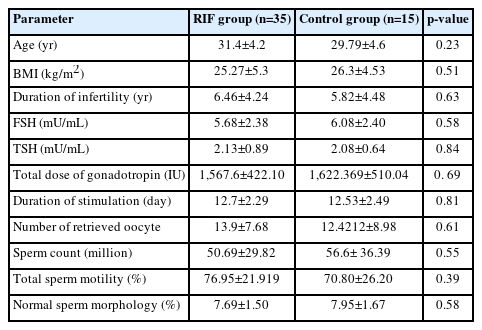
Demographic and clinical data of the study women and sperm parameters of their partners
2. IGF-1 protein level
For the evaluation of IGF-1 protein expression, total protein content was measured based on the Bradford protein assay standard curve and regression linear equation. No significant difference was found in the IGF-1 protein level of the embryo culture medium obtained from the RIF and control groups. The corresponding protein bands generated by Western blotting and densitometry graphs of IGF-1 protein levels in both groups are shown in Figure 1.

The insulin-like growth factor 1 (IGF-1) protein expression in culture medium from the repeated implantation failure (RIF) and control groups. Values are presented as mean±standard deviation of at least three replicates. GAPDH, glyceraldehyde 3-phosphate dehydrogenase.
3. Glucose, pyruvate, and lactate assay
The RIF group had higher glucose (significant) and pyruvate (non-significant) concentrations than the control group, but significantly lower Lactate concentrations (p<0.05) (Figure 2).
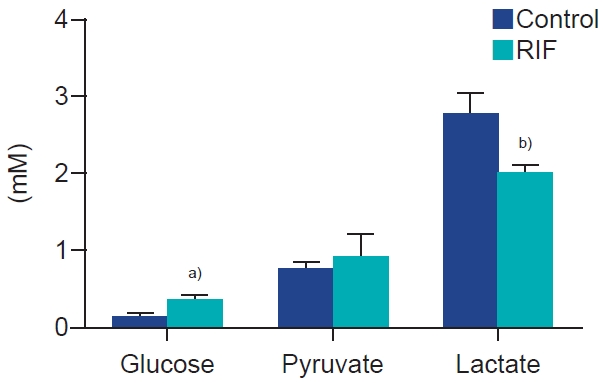
Glucose, pyruvate, and lactate concentrations in the repeated implantation failure (RIF) and control groups. Values are presented as mean±standard deviation of three replicates. a)p<0.05; b)p<0.01.
4. Inorganic ion concentration assay
The concentrations of calcium, magnesium, sodium, and chloride in the embryo culture medium of the RIF and control groups were determined through ion colorimetric assay kits. No significant difference was noted in calcium, chloride, and sodium concentrations between the RIF group and the control group, but the magnesium concentration was significantly lower in the RIF group than in the controls (p<0.05) (Figure 3).
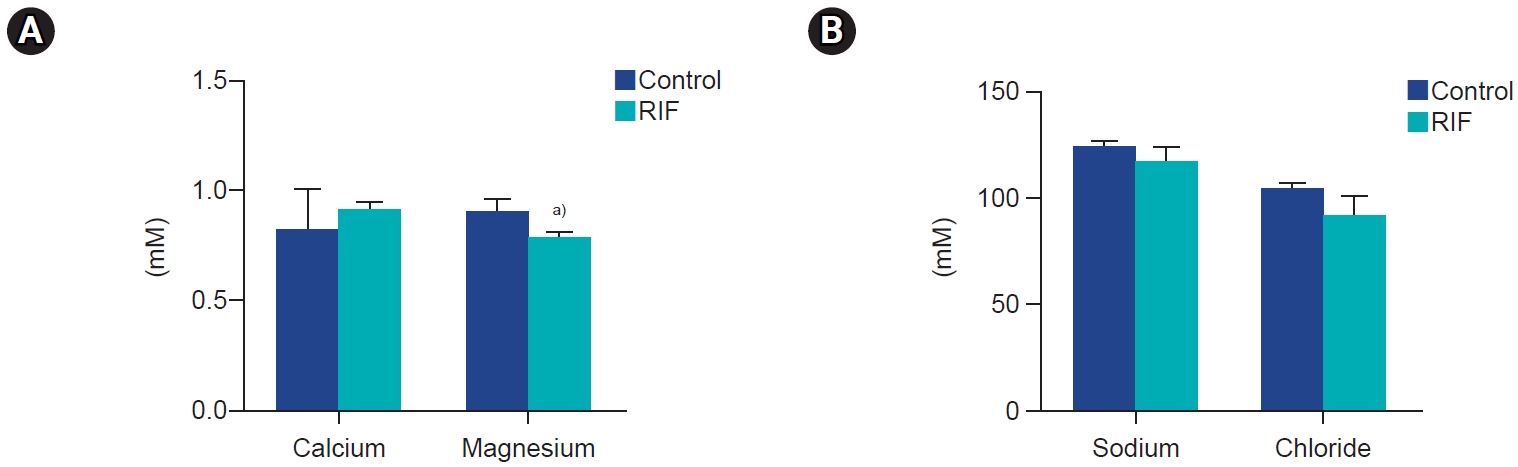
Comparison of (A) calcium, and magnesium and (B) sodium and chloride concentrations between the repeated implantation failure (RIF) and control groups. Values are presented as mean±standard deviation of three replicates. a)p<0.05.
5. Amino acid concentration assay
HPLC showed that there were no significant differences in histidine, methionine, and phenylalanine concentrations between the RIF group and the control group, but the glutamic acid and aspartic acid levels were 50% and 36% higher in the RIF group than in the control group, respectively (p<0.01 and p<0.001) (Figure 4).

Comparison of histidine, methionine, phenylalanine, glutamic acid, and aspartic acid concentrations between the repeated implantation failure (RIF) and control groups. Values are presented as mean±standard deviation of three replicates. a)p<0.01; b)p<0.001.
Discussion
In this study, we examined the concentration of several metabolites, including glucose, lactate, glutamic acid, aspartic acid, and magnesium, in the embryo culture medium. Significant differences were found between the RIF patients and controls. However, the concentrations of IGF-1, sodium, calcium, chloride, methionine, histidine, and phenylalanine did not show significant differences between the two groups.
IGF-1 plays an important role in early embryonic development through processes such as inhibiting apoptosis and regulating glucose metabolism [21-23]. Agrogiannis et al. [24] (2014) showed that the expression of IGF-1 and its receptors are activated on the third embryonic day. At this stage, IGF-1 binds to its receptors and stimulates amino acid and glucose consumption. In addition, IGF-1 expression affects differentiation, blastocyst formation, and embryo implantation [24-26]. However, if its concentration in the culture medium is too high, it will have a toxic effect on the embryo [27]. In this study, there was no significant difference in IGF-1 expression between the RIF and control groups. However, comparing the consumption of this metabolite between the RIF and control groups in the blastocyst stage may lead to reliable results regarding the effect of this factor on implantation potential.
In this study, the RIF group exhibited less pyruvate consumption and lactate secretion than the control group. Pyruvate is the main source of energy in the early stages of embryo development. High consumption of pyruvate and secretion of lactate during the early stages of embryonic development (up to the 8-cell stage) activate the tricarboxylic acid cycle in the mitochondria and respiratory chain [28]. Previous research by Gott et al. [29] (1990) demonstrated that arrested or degenerated embryos displayed lower pyruvate uptake and lactate production compared to normally developed embryos. Additionally, embryos reaching the blastocyst stage showed significantly higher pyruvate uptake than those not reaching this stage [30]. Adenosine triphosphate (ATP) production in embryos relies primarily on pyruvate oxidation, with exogenous pyruvate playing a vital role. However, a substantial portion of pyruvate is converted to lactate rather than being used for oxidative phosphorylation. Lactate serves as an energy source and a potent cytosolic reductant, protecting cells from oxidative stress and damage [28].
The decreased pyruvate consumption and lactate secretion observed in RIF embryos may negatively impact their implantation ability. Pyruvate and lactate play crucial roles in early embryonic development, and reduced levels of these substances could hinder successful implantation. Furthermore, glucose is another important energy source for embryos. However, until the 8-cell stage, glucose is not considered the main energy source and its consumption is less than pyruvate. Subsequently, glucose consumption increases significantly during the 8-cell, blastocyst, and implantation stages [31], which is due to the synthesis of glucose transporters and activation of the glycolysis pathway [32]. Our findings indicate lower glucose absorption in the RIF group than in the control group. Chi et al. [33] (2020) showed that embryos cultured in a glucose-containing culture medium can develop to the blastocyst stage, while embryos in a glucose-free culture medium can only develop to the 4-cell stage. Lower glucose absorption may affect the quality of the embryo and its implantation ability.
Numerous studies have highlighted the significance of ion concentrations in the embryo culture medium for embryo development and implantation [34,35]. In line with this, our current research found that the RIF group exhibited lower levels of sodium and chloride than the control group, which is attributed to elevated consumption of these ions. The outcomes of our study, coupled with previous research, indicate that increased intracellular levels of sodium and chloride can disrupt cellular processes. Specifically, higher sodium and chloride concentrations impede protein synthesis, affecting embryo growth and differentiation [36,37]. Additionally, our study identified a noteworthy disparity in magnesium and calcium concentrations between the RIF and control groups. The RIF group displayed reduced magnesium levels and elevated calcium levels, suggesting different consumption patterns of these ions by the embryos. These findings are consistent with previous studies, emphasizing the pivotal role of calcium in fertilization, the cleavage stage, and implantation. Moreover, earlier research has demonstrated that magnesium, acting as a chelating agent, can inhibit calcium's function in signaling pathways, ultimately impacting embryo growth and implantation [38,39]. Furthermore, excessive magnesium consumption by the embryo can hinder calcium usage in mitochondria, inhibiting ATP production along the electron transfer chain and subsequently reducing successful implantation [40].
Regarding amino acid consumption, our study identified higher concentrations of aspartic acid and glutamic acid in the culture medium of embryos from the RIF group than in those from the control group. This discrepancy suggests greater consumption of these amino acids by embryos from healthy women compared to those with from women with RIF. However, no significant differences were observed in the consumption of methionine, phenylalanine, and histidine between the two groups. Notably, recent investigations into the metabolic characteristics of culture medium used during IVF procedures have demonstrated that specific amino acids can enhance in vitro embryo development, benefiting pre-implantation embryos in various ways [41]. Moreover, some studies have highlighted the role of certain amino acids as intracellular pH-regulating buffers in embryos, influencing embryo differentiation and blastocyst implantation [41,42]. For instance, a study exploring the relationship between culture medium for 3-day human embryos and implantation potential revealed that amino acid concentrations could be used to predict the implantation rate; it also found significant differences in amino acid levels, including aspartic acid, serine, histidine, and alanine, between pregnant and non-pregnant groups [43]. The difference observed in the consumption of aspartic acid and glutamic acid by embryos in the RIF group in our study may be related to embryo competence.
Overall, our study's findings shed light on the distinct metabolic profile of the culture medium in the RIF group compared to the control group. These results provide a fresh perspective on potential factors influencing embryo competence in implantation among RIF patients.
Notes
Conflict of interest
No potential conflict of interest relevant to this article was reported.
Author contributions
Conceptualization: SN, AG, NN, SG, FR, FA, GT. Data curation: SN, AG. Formal analysis: NN, SG, FR. Funding acquisition: GT. Methodology: SN, AG, FA, GT. Project administration: FA, GT. Visualization: NN, SG, FR. Writing-original draft: SN, AG. Writing-review & editing: FA, GT.
Acknowledgements
The authors would like to thank Iran University of Medical Sciences (IUMS), Tehran, Iran for their cooperation throughout the period of study.