Ovarian volume is more closely related to the different manifestations of polycystic ovary syndrome than follicle number per ovary
Article information

Abstract
Objective
Polycystic ovary (PCO), a diagnostic component of polycystic ovary syndrome (PCOS), requires either an ovarian volume (OV) criterion or a follicle number per ovary (FNPO) criterion. This study investigated the association of OV and FNPO criteria with various manifestations of PCOS.
Methods
This cross-sectional study was conducted at a university hospital among 100 patients newly diagnosed with PCOS (according to the revised Rotterdam criteria). Fasting blood samples were collected to measure glucose, total testosterone (TT), luteinizing hormone (LH), follicle-stimulating hormone (FSH), lipid, insulin, and hemoglobin A1c levels. An oral glucose tolerance test was performed. Transabdominal or transvaginal ultrasound of the ovaries was done, depending on patients’ marital status. All investigations were conducted in the follicular phase of the menstrual cycle. OV >10 mL and/or FNPO ≥12 indicated PCO. A homeostasis model assessment of insulin resistance (IR) value ≥2.6 indicated IR, and metabolic syndrome (MS) was defined according to the international harmonization criteria.
Results
Seventy-six participants fulfilled the OV criterion, 70 fulfilled the FNPO criterion, and 89 overall had PCO. Both maximum OV and mean OV had a significant correlation with TT levels (r=0.239, p=0.017 and r=0.280, p=0.005, respectively) and the LH/FSH ratio (r=0.212, p=0.034 and r=0.200, p=0.047, respectively). Mean OV also had a significant correlation with fasting insulin levels (r=0.210, p=0.036). Multivariate binary logistic regression analysis showed that IR (odds ratio [OR], 9.429; 95% confidence interval [CI], 1.701 to 52.271; p=0.010) and MS (OR, 7.952; 95% CI, 1.821 to 34.731; p=0.006) had significant predictive associations with OV alone, even after adjustment for age and body mass index.
Conclusion
OV may be more closely related to the androgenic and metabolic characteristics of PCOS than FNPO.
Introduction
Polycystic ovary syndrome (PCOS) is a complex disorder of unknown origin that affects approximately 10% of females of reproductive age. In addition to reproductive problems, patients may suffer from cutaneous, cardiometabolic, and psychiatric problems [1]. However, PCOS is still an indeterminate disease of unknown pathophysiology and, because of its heterogeneous presentation, several diagnostic criteria have been proposed. The most widely accepted criteria for diagnosing PCOS are the revised 2003 Rotterdam consensus criteria. Among the three components of these criteria, the most debatable and least specific is polycystic ovary (PCO) on ultrasonography (USG), because it is operator-dependent; differs with age, body mass index (BMI), ethnicity, route of USG used, and frequency of the USG probe; and must be performed in the follicular phase of the menstrual cycle [2]. The 2018 international evidence-based guidelines for PCOS recommended using this component as a last resort [3]. Despite the limitations in identifying PCO in isolation, it is considered to reflect a state of mild ovarian hyperandrogenism and insulin resistance (IR) [4]. Both IR and the increased pulse frequency of luteinizing hormone (LH) contribute to theca cell proliferation and increased androgen production by the ovary [5,6]. PCO may also reflect nutritional and metabolic influences on the reproductive axis [7]. Therefore, PCO may be a window into PCOS and its different manifestations. However, the relationship of PCO to the various characteristics of PCOS remains a matter of debate. Furthermore, there are limited data from South Asian populations on the association of PCO with the manifestations of PCOS; thus, this study aimed to identify those associations in patients from Bangladesh.
Methods
This cross-sectional observational study was conducted in the outpatient clinic of the Department of Endocrinology at a university hospital from September 2018 to February 2019. The minimum sample size was calculated using the following formula: n=Z2pq/d2. Using the prevalence of PCO in PCOS (p=0.84), a 10% margin of error (d), and a 95% confidence interval (CI) (Z=1.96), the minimum sample size (n) was approximately 52 [6]. We were able to enroll 100 patients with PCOS. Written informed consent was obtained from all participants, and the Institutional Review Board of Bangabandhu Sheikh Mujib Medical University (No. BSMMU/2018/11097, Date: 17/09/2018) approved this study.
We requested that patients with symptoms suspicious of PCOS (oligomenorrhea and/or significant hirsutism) present to the clinic in a fasting state (8 to 12 hours) during days 2 to 5 of spontaneous menstruation or randomly for those with amenorrhea. The patients’ personal and family histories were obtained, and physical examinations were completed (height, weight, waist circumference [WC], blood pressure, and documentation of any hirsutism, acne, or acanthosis nigricans). Fasting blood was taken to measure glucose, insulin, total testosterone (TT), prolactin, thyroid stimulating hormone (TSH), 17-hydroxy progesterone, and lipid levels. Next, an oral glucose tolerance test (OGTT) was conducted. IR was calculated using the homeostasis model assessment (HOMA) of IR: HOMA-IR=(fasting insulin [μIU/mL]×fasting plasma glucose [FPG, mmol/L])/22.5. USG of the ovaries was performed on all participants by a single expert sonologist, with either a transabdominal (TAS) (unmarried women, n=60) or transvaginal (TVS) (married women, n=40) approach. USG was done during days 2 to 7 of menstruation for the TAS route and just after cessation of menstruation but within 10 days of its onset for the TVS route.
A diagnosis of PCOS was based on the revised 2003 Rotterdam consensus criteria [8]. Oligo-ovulation or anovulation was diagnosed for delayed menstruation (>35 days) or fewer than nine spontaneous menstrual cycles per year. Clinical hyperandrogenism was defined as significant hirsutism with a measured modified Ferriman-Gallwey (mFG) score ≥8, and biochemical hyperandrogenism was defined as a TT level >46 ng/dL. PCO was identified on USG as ≥12 follicles in any ovary measuring 2 to 9 mm in diameter and/or any increased ovarian volume (OV) >10 cm3 [8]. Participants with primary amenorrhea, hyperprolactinemia (serum prolactin >25.0 ng/mL), hypothyroidism (TSH >5.0 µIU/mL), Cushing syndrome, or systemic illnesses such as chronic liver or kidney disease were excluded. Participants treated with oral contraceptives, metformin, or glucocorticoids within 3 months of starting the study were excluded.
Glucose was measured by glucose oxidase, lipids by peroxidase-dehydrogenase, and all hormones by chemiluminescent microparticle immunoassay. The TOSHIBA Aplio 500 USG imaging machine, with 3.5 MHz for TAS and 3 to 11 MHz for TVS, was used with all participants. OV was calculated using the simplified formula of an ellipsoid (0.5×length×width×thickness of the ovary) structure using three-dimensional USG. The number of follicle number per ovary (FNPO) included the total number of antral follicles present throughout the entire volume of each ovary.
A BMI ≥25 kg/m2 and a WC ≥80 cm indicated generalized obesity and central obesity, respectively. Any abnormality in FPG (≥5.6 mmol/L), 2-hour OGTT glucose (≥7.8 mmol/L), or glycated hemoglobin (≥5.7%) indicated abnormal glycemic status. In this study, a HOMA-IR value ≥2.6 was considered to indicate IR, and metabolic syndrome (MS) was defined by the international harmonization criteria [9,10].
Statistical analysis was done using SPSS version 22.0 (IBM Corp.). Data were expressed as frequency (percentage [%]) or median (interquartile range [IQR]). Comparisons between groups were conducted using the chi-square test, Fisher exact test, or Mann-Whitney U test, as appropriate. The correlations of OV and FNPO with the clinical and biochemical variables were analyzed using the Spearman correlation test. Binary logistic regression analysis was used to identify the predictive associations of the different manifestations of PCOS, with OV and FNPO as dependent variables. Statistical significance was set at a p-value <0.05.
Results
Considering both ovaries, 76 participants fulfilled the OV criterion, 70 fulfilled the FNPO criterion, and 89 overall had PCO. The median OV was 11.50 mL (IQR, 8.90 to 14.20), and the median FNPO was 12.0 (IQR, 9.0 to 16.0). Considering the presence of hyperandrogenism (HA), ovulatory dysfunction (OD), and PCO, the frequency of phenotypes A (HA+OD+PCO), B (HA+OD), C (HA+PCO), and D (OD+PCO) were 46, 11, 10, and 33, respectively. The characteristics of the study population with PCO are shown in Table 1. PCOS patients without PCO had a significantly higher percentage of hyperandrogenism than those with PCO. However, patients with PCO had a significantly higher percentage of hyperandrogenemia, but a lower percentage of significant hirsutism. Other variables were statistically similar in patients with or without PCO (not statistically significant [NS] for all).

Characteristics of the study population with PCO (n=100)
When patients were categorized by the OV and FNPO criteria, patients with an OV >10 mL had a significantly higher percentage of acanthosis nigricans than those with an OV ≤10 mL. No other variable had a significant association with the OV and FNPO criteria (NS for all) (Table 2).
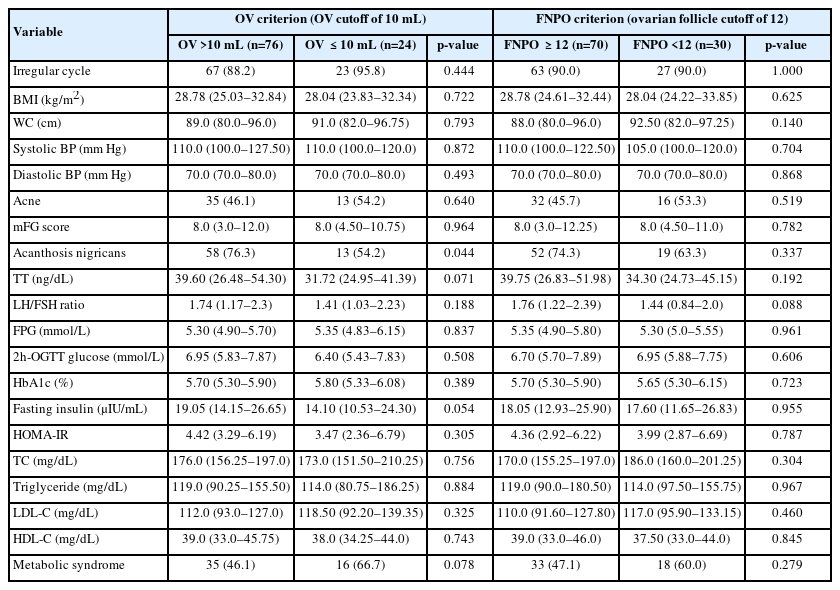
Clinical and biochemical characteristics of the study population according to the OV and FNPO criteria
Both maximum and mean OV had a significant correlation with TT levels and the LH/follicle-stimulating hormone (FSH) ratio. The mean OV also had a significant correlation with fasting insulin levels. No variable had a significant correlation with either the maximum or mean FNPO (NS for all) (Table 3). However, when the FNPOs were divided according to USG route, both maximum (r=0.345, p=0.029) and mean FNPO (r=0.371, p=0.018) via TVS (n=40) were significantly correlated with TG levels only.
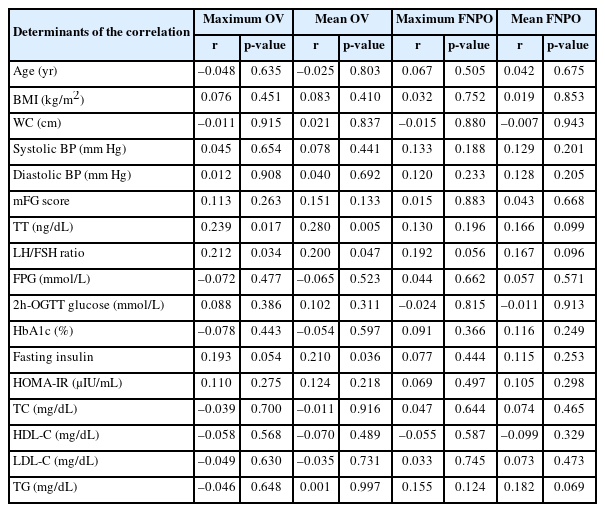
Correlations between the clinical and biochemical characteristics of polycystic ovary syndrome and the OV and FNPO criteria
Multivariate binary logistic regression analysis showed that IR (odds ratio [OR], 9.429; 95% CI, 1.701 to 52.271; p=0.010) and MS (OR, 7.952; 95% CI, 1.821 to 34.731; p=0.006) had significant predictive associations with the OV criterion only, even after adjustment for age and BMI (Table 4).
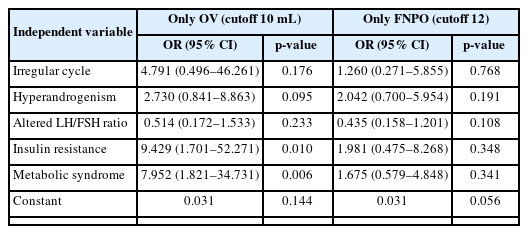
Multivariate binary logistic regression analysis of OV and FNPO as dependent variables
Discussion
We found that approximately 90% of patients with PCOS had PCO, while Legro et al. [11] (USA) and Carmina et al. [12] (Italy) found 95%, and Hong et al. [13] (China) found 80%. Since the OV varies with race, the cutoffs for OV and FNPO may not be universal. A study of the Indian population proposed a cutoff value of 8 mL and nine follicles for the OV and FNPO criteria, respectively [14]. In our study, the median OV (considering both ovaries) was 11.50 mL and the FNPO was 12. These results were similar to those of Ahmed et al. [14] (2014) (OV 11 mL and 13 FNPO). Shi et al. [15] found no significant differences in age, BMI, WC, LH/FSH ratio, or glucose and insulin levels, which supports our results. However, they also found a worse lipid profile in the non-PCO group compared to the PCO group, which we did not.
PCOS patients are divided into: With PCO and Without PCO. PCOS patients without PCO had higher percentages of hyperandrogenemia than those with PCO. Interestingly, patients with PCO had significantly higher percentages of hyperandrogenemia, but lower percentages of clinical hyperandrogenism (as measured by the presence of significant hirsutism) than those without PCO. Shi et al. [15] found significantly higher TT levels and mFG scores in patients without PCO than in those with PCO among Chinese patients with PCOS. PCOS is a varied condition, and the correlation with mFG scores and TT levels is generally poor. Hyperandrogenemia may contribute to more metabolic abnormalities in patients without PCO [16]. We found a significant association with acanthosis nigricans for the OV criterion only. Acanthosis nigricans is a specific dermatological manifestation that may also correlate with the androgenic and metabolic characteristics of PCOS [17].
We found significant correlations between OV and TT levels, the LH/FSH ratio, and fasting insulin levels. Carmina et al. [12] also found a significant correlation between OV and insulin levels. The OV correlations with LH and FSH can also predict the severity of PCOS [18]. Another study reported that, except for the LH/FSH ratio, there were no significant associations between any metabolic, androgenic, or reproductive manifestations and either the OV or the FNPO criterion [11]. Similarly, in 2014, Chun [19] found a significant correlation between OV and LH/FSH ratio in Korean women. van der Westhuizen and van der Spuy [20] reported that, among various hormones, the LH/FSH ratio had the closest overall association with PCO.
We found significant predictive associations between the OV criterion and IR or MS. Several studies have also found significant associations between OV and insulin levels and several components of MS [12,21]. Sipahi et al. [22] found that higher OV was associated with a greater risk of MS. In contrast, Bahri Khomami et al. [23] did not find significant predictive associations between PCO and IR, MS, or dyslipidemia.
We found significant associations between the different manifestations of PCOS and OV, but not with FNPO. Similarly, Reid et al. [21] did not find significant associations using either the 12 or 25 cutoffs of the FNPO criterion. In contrast, Hong et al. [13] found significant associations between IR and both the OV and FNPO criteria. Christ et al. [24] found associations of reproductive and metabolic features with antral follicular count and size, but not with OV. However, we could not use TVS to measure the FNPO in all patients. Although the association between PCO and the different manifestations of PCOS remained inconclusive in this study, we did not find any significant association between the manifestations of PCOS and FNPO in the patients (n=60) who did undergo TVS. In addition, we could not measure levels of sex hormone-binding globulin to calculate the free androgen index or anti-Müllerian hormone levels to analyze their association with PCO.
In conclusion, of the two diagnostic criteria for PCO, OV demonstrated a closer relationship to the androgenic and metabolic characteristics of PCOS than FNPO. Furthermore, because there were several limitations to the measurement of FNPO, we recommend using the OV criterion alone, especially in resource-poor settings.
Notes
Conflict of interest
No potential conflict of interest relevant to this article was reported.
Author contributions
Conceptualization: SA, HB, MAH. Data curation: SA, AH. Formal analysis: SA, MSM, HB. Methodology: SA, JAH, MSM, HB, AH, MAH. Writing-original draft: SA, MSM, HB, AH. Writing-review & editing: JAH, MAH.
Acknowledgements
We are grateful to the Department of Microbiology and Immunology and the Department of Biochemistry and Molecular Biology of Bangabandhu Sheikh Mujib Medical University for their technical support.