The pregnancy outcomes of day-5 poor-quality and day-6 high-quality blastocysts in single blastocyst transfer cycles
Article information

Abstract
Objective
This study compared the outcomes of single blastocyst transfer cycles, using day- 5 poor-quality blastocysts and day-6 high-quality blastocysts.
Methods
We analyzed 462 frozen-thawed embryo transfer (FET) cycles performed at our center from January 2014 to December 2019. The cycles were divided into two groups: a day-5 poor-quality blastocyst transfer group (group A) and a day-6 high-quality blastocyst transfer group (group B). The clinical outcomes were tested.
Results
In groups A and B, respectively, the clinical pregnancy rate (CPR; 61.65% vs. 67.17%, p=0.258), implantation rate (IR; 61.65% vs. 67.17%, p=0.258), and live birth rate (LBR; 69.51% vs. 77.83%, p=0.134) showed no significant differences. Moreover, when day-3 embryo quality was considered, the CPR, IR, and LBR were also similar in group A and group B (p > 0.05).
Conclusion
The clinical outcomes of day-5 poor-quality blastocysts and day-6 high-quality blastocysts were similar, suggesting that the developmental speed of the embryo might be more important than embryo quality for the clinical outcomes of single blastocyst transfer in FET cycles.
Introduction
In assisted reproductive technology cycles, embryos can be transferred during the cleavage stage and the blastocyst stage. Several meta-analyses have shown that blastocyst transfers have a higher implantation rate (IR) than cleavage-stage embryo transfers [1,2]. Single blastocyst transfer (SBT) is becoming widely popular due to improved blastocyst culture conditions and the reduction in multiple pregnancies.
Usually, embryos cultured in vitro develop into blastocysts on day 5 (D5) after fertilization, but some embryos grow slower and develop into blastocysts on day 6 (D6) or later. The pregnancy outcomes of high-quality blastocysts are significantly greater than those of poor-quality blastocysts, whereas low blastocyst morphology scores are associated with significantly lower clinical pregnancy rate (CPR) and live birth rate (LBR) [3]. Several studies have found that D5 blastocyst transfers had higher CPRs than D6 blastocyst transfers in fresh embryo transfer cycles [4-6]. However, the clinical outcomes of D5 and D6 blastocyst transfers were inconsistent in frozen-thawed embryo transfer (FET) cycles [7, 8]. Most studies have compared the outcomes of D5 and D6 blastocysts of similar quality or blastocysts of different quality from the same developmental day. However, the clinical outcomes of D5 poor-quality blastocysts versus D6 high-quality blastocysts have not been studied.
In clinical settings, some patients have only D5 poor-quality blastocysts and D6 high-quality blastocysts, and it has been unclear which is the better choice. In this study, to determine which had better clinical outcomes, we performed a retrospective analysis to compare the clinical outcomes of D5 poor-quality blastocysts with those of D6 high-quality blastocysts in FET cycles.
Methods
1. Patients
In this retrospective study, we analyzed 462 FET cycles conducted in our center from January 2014 to December 2019. The cycles included women aged ≤40 years, with an endometrial thickness ≥7 mm, and undergoing their first FET cycle. Cycles that included donated oocytes, embryos that had undergone preimplantation genetic testing, and fresh-transfer embryos were excluded. The FET cycles were separated into two groups: the D5 poor-quality blastocyst transfer group (group A) and the D6 high-quality blastocyst transfer group (group B).
This study was approved by the Ethics Review Board of Guangdong Second Provincial General Hospital (No. 20200713-YXKXYJ-LW-01-02). Duo to the retrospective study, the informed consent was waived.
2. Laboratory protocol
According to semen parameters, in vitro fertilization or intracytoplasmic sperm injection was performed as previous descriptions [9]. Embryos were cultured in the incubator at 6% CO2, 5% O2, and 37℃. G-1 PLUS and G-2 PLUS (10128 and 10132; Vitrolife, Gothenburg, Sweden) were used for the cleavage stage and blastocyst stage cultures, respectively. On day 3 (D3), a high-quality embryo was defined as one with 7–9 even blastomeres and a fragmentation rate <20%. According to the Gardner criteria [10], grade 4–6 blastocysts with subgrades BC or CB on D5 or D6 were defined as poor-quality blastocysts, and high-quality blastocysts as grade 4–6 with subgrades AA, AB, BA, or BB.
Blastocysts were vitrified/warmed using a Vitrification Freezing/Thawing Kit (VT101 and VT102; Kitazato Corp., Tokyo, Japan). Briefly, for vitrification, the blastocyst was placed into equilibration solution for 7 minutes at room temperature, then moved into the vitrification solution for approximately 40 seconds, put onto the tip of a Cryotop (Kitazato Corp., Tokyo, Japan), and immediately frozen in liquid nitrogen. To rewarm the blastocyst from the Cryotop, it was transferred into prewarmed thawing solution for 1 minute, then transferred into dilution solution for 3 minutes at room temperature, and washed with washing solution for 10 minutes. After thawing, the blastocysts were cultured for 2–3 hours before transfer.
3. Endometrial preparation and embryo transfer
In this study, endometrial preparation was done using the hormone replacement treatment program. Estradiol (4–12 mg/day; Progynova, Bayer, Leverkusen, Germany) was taken orally from the second day of menstruation. When the endometrial thickness reached ≥7 mm, progesterone (40 mg/day) was injected and dydrogesterone (20 mg/day) (Duphaston, Abbott, Netherlands) was added. Blastocyst transfer was performed on the fifth day after the progesterone injection. After embryo transfer, luteal support was continued and the main clinical outcome measures were analyzed, as described previously [9].
4. Statistical analysis
Mean and standard deviation or percentage were used to express the data. The Student t-test or chi-square test was used for data analysis. IBM SPSS ver. 19.0 (IBM Corp., Armonk, NY, USA) was used for the statistical analysis. Statistical significance was indicated by p-values <0.05.
Results
In this study, 133 cycles in group A and 329 cycles in group B were analyzed (Figure 1). The maternal age at oocyte pick-up (OPU), pattern of infertility, and the factors of infertility between group A and group B were not statistically different (p>0.05) (Table 1). The CPR (61.65% vs. 67.17%, p=0.258), IR (61.65% vs. 67.17%, p=0.258), and LBR (69.51% vs. 77.83%, p=0.134) were not significantly different in group A and group B, respectively (Table 1). The multiple pregnancy rate (MPR; 3.66% vs. 3.17%, p=0.832) and miscarriage rate (MR; (26.83% vs. 21.27%, p=0.305) were similar (Table 1). Moreover, the birth weight (BW) of group A was not significantly different, compared with group B (3,196.84±496.53 vs. 3,236.25±519.82, p=0.609) (Table 1).
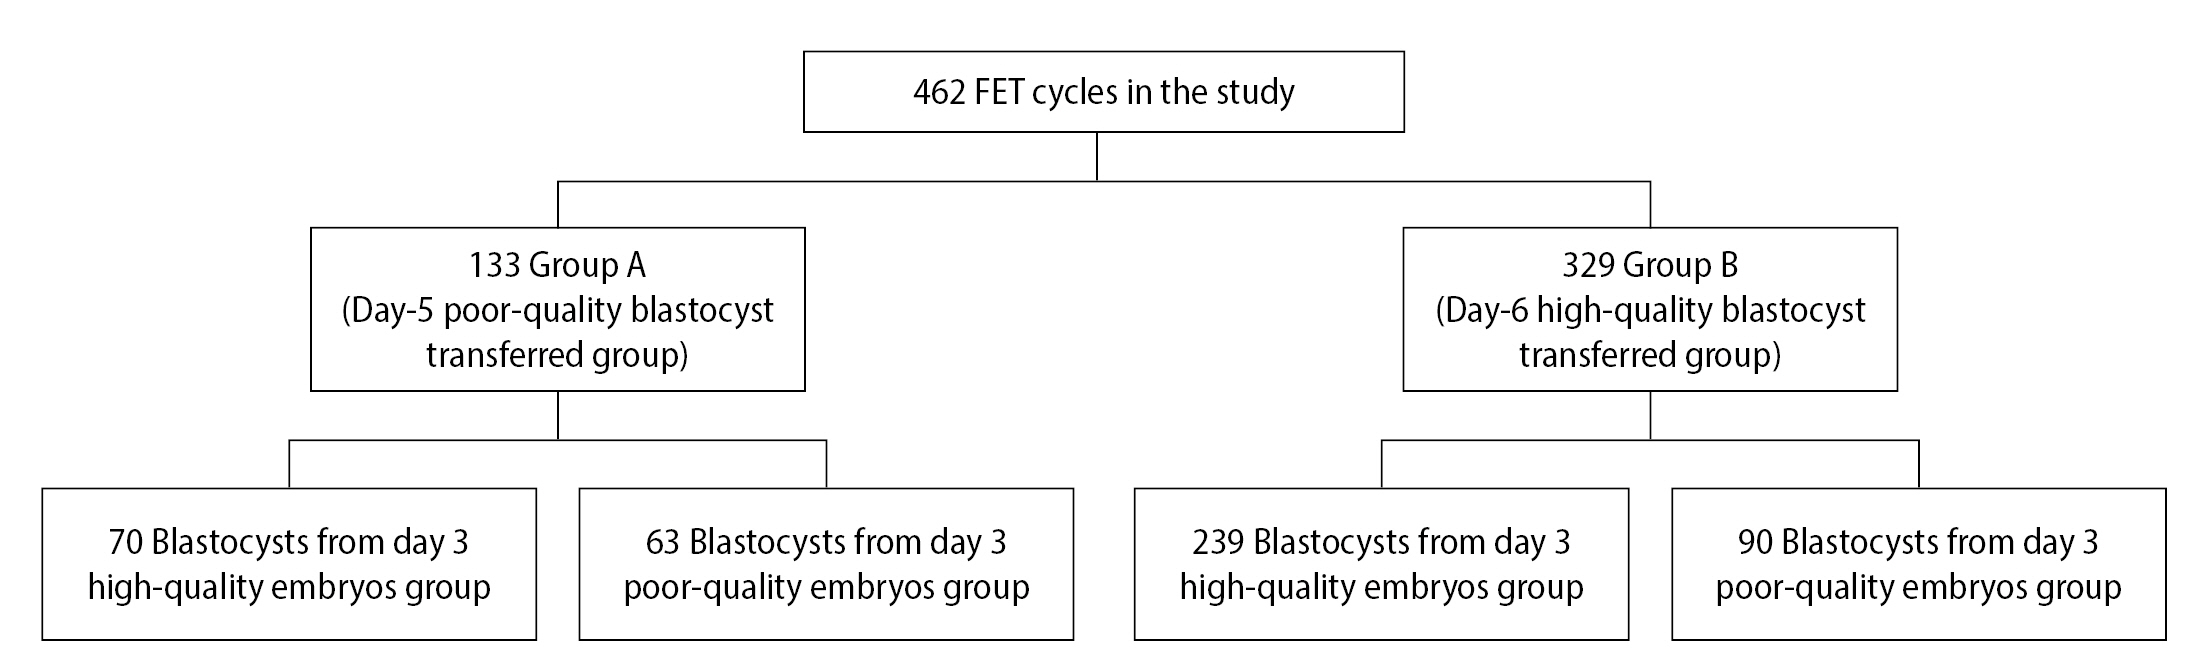
Flowchart of this study. FET, frozen-thawed embryo transfer.
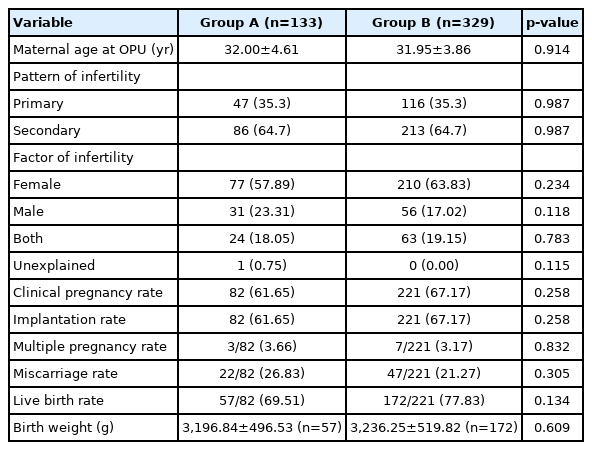
Demographic and clinical characteristics of FETs in the two groups
To determine the effect of blastocyst quality on the outcomes of blastocyst transfer in FET cycles, we examined the outcomes of the blastocysts from D3 high-quality or poor-quality cleavage embryos. For D3 high-quality cleavage embryos, the CPR (65.71% vs. 69.46%, p=0.148), IR (65.71% vs. 69.46%, p=0.148), LBR (69.57% vs. 78.31%, p=0.216), MPR (6.52% vs. 3.01%, p=0.269), MR (26.09% vs. 22.29%, p=0.589), and BW (3,209.71±537.70 vs. 3,231.42±539.02, p=0.835) were similar in group A and group B, respectively (Table 2). For D3 poor-quality cleavage embryos, there were no significant differences in the CPR (57.14% vs. 61.11%, p=0.623), IR (57.14% vs. 61.11%, p=0.623), LBR (69.44% vs. 76.36%, p=0.464), MPR (0.00% vs. 3.64%, p=0.247), MR (27.78% vs. 18.18%, p=0.280), and BW (3,197.60±427.94 vs. 3,251.19±461.00, p=0.638), when comparing group A with group B (Table 2).
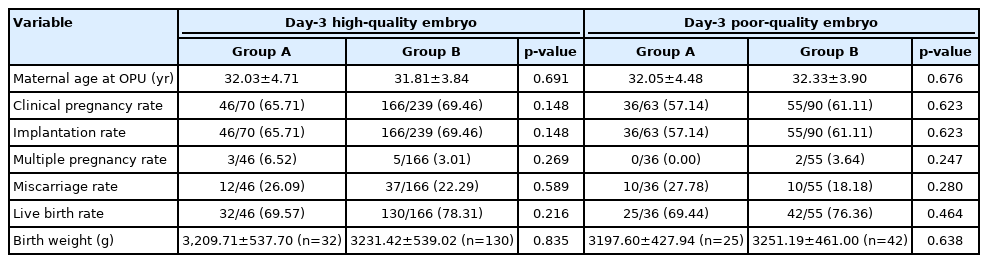
The influence of day-3 embryo quality in the two groups
To determine the effect of developmental speed on the outcomes of blastocyst transfer in FET cycles, we examined the outcomes of D5 and D6 blastocysts from D3 high- or poor-quality cleavage embryos. In group A, the CPR (65.71% vs. 57.14%, p=0.310), IR (65.71% vs. 57.14%, p=0.310), LBR (69.57% vs. 69.44%, p=0.991), MPR (6.52% vs. 0.00%, p=0.119), MR (26.09% vs. 27.78%, p=0.864), and BW (3,209.71±537.70 vs. 3,197.60±427.94, p=0.926) showed no significant differences between the blastocysts from D3 high-quality cleavage embryos and the blastocysts from D3 poor-quality cleavage embryos (Table 3). Additionally, in group B, the CPR (69.46% vs. 61.11%, p=0.151), IR (69.46% vs. 61.11%, p=0.151), LBR (78.31% vs. 76.36%, p=0.763), MPR (3.01% vs. 3.64%, p=0.819), MR (22.29% vs. 18.11%, p=0.519), and BW (3,231.42±539.02 vs. 3,251.19±461.00, p=0.831) of the blastocysts from D3 high-quality cleavage embryos were similar to the blastocysts from D3 poor-quality cleavage embryos (Table 3).
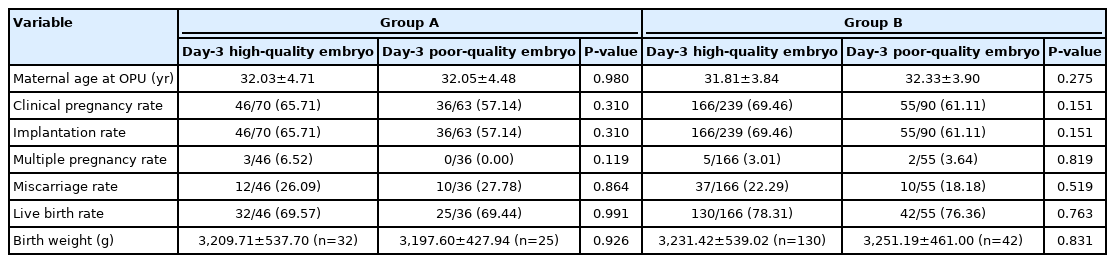
The influence of day-3 embryo quality in the two groups
Discussion
In this study, to determine whether it is better to select a D5 poor-quality blastocyst or a D6 high-quality blastocyst for SBT cycles, we examined the clinical outcomes of group A and group B. The clinical outcomes in group A and group B were not significantly different (p>0.05). Moreover, the results of our study also suggested that the quality of the D3 embryos did not affect the clinical outcomes of blastocyst transfer in FET cycles (p>0.05).
In fresh embryo transfer cycles, several studies have shown that D5 blastocyst transfer has a higher CPR than cycles with D6 blastocyst transfer [4-6]. The reason for this may be that ovarian stimulation can change endometrial development, which leads to an accelerated closure of the implantation window, and may have resulted in the lower CPR and LBR of the D6 blastocyst transfer group compared to those of the D5 blastocyst transfer group [11,12]. A comparison of autologous fresh and FET cycles in which D6 blastocysts were transferred showed that the D6 blastocysts had significantly higher CPR and IR in the FET cycles than in the fresh cycles (p<0.01) [6,13]. The CPR and IR were significantly higher in the D6-on-D5 (D6 blastocysts transferred on day 5) group than in the D6-on-D6 (D6 blastocysts transferred on day 6) group, and the early MR was similar in the two groups. This suggested that the suitable timing for transfer of D6 blastocysts might be day 5 in FET cycles [14]. In this study, we transferred the D5 blastocysts and D6 blastocysts on day 5 after progesterone injected in the FET cycles to avoid decreased endometrial receptivity.
In FET cycles, the outcome of D5 and D6 blastocyst transfers are conflicting [15-19], which may be due to differences in study design and vitrification/warming protocols. One meta-analysis found that there were no significant differences in the CPR and LBR between D5 and D6 blastocyst transfers, when the embryos were at the same stage of development and the slow-freezing technique was used [7]. Regarding vitrification methods, Tubbing et al. showed that significant differences in CPR and LBR were observed between D5 and D6 blastocyst transfers. Though the stage of development was taken into consideration, the blastocyst quality was not [15]. Ferreux et al. [16] showed that D5 blastocysts led to better outcomes than D6 blastocysts in terms of the CPR and LBR, both in good- and low-quality blastocysts. Sciorio et al. [17] reported that the CPR and IR per single high-quality blastocyst transfer were higher in the D5 group than those in the D6 group. Yang et al. [18] found that the CPR and the IR of D5 euploid blastocysts were significantly higher than in D6 euploid blastocysts. However, the CPR and IR of D5 were like those of D6 when high-quality blastocysts were transferred that had undergone preimplantation genetic testing for aneuploidy [18]. Kaye et al. [19] reported that the CPR and LBR were similar, when slow-frozen and vitrified D5 and D6 high-quality blastocysts were transferred. Most reports compared the outcomes of D5 and D6 blastocysts of similar quality or blastocysts of different quality from the same developmental day. However, no previous studies had compared the clinical outcomes of D5 poor-quality blastocysts and D6 high-quality blastocysts, as we did in this study. Our study showed that the CPR, IR, and LBR were similar in both groups (p>0.05) (Table 1). The reason could be that some D5 low-quality blastocysts developed into high-quality blastocysts after embryo transfer. Haas et al. [20] reported that 21% of post-thawed D5 fair-quality blastocysts, after being cultured for 20–22 hours, developed into good-quality blastocysts.
Previous studies have shown that D3 cleavage-stage embryo quality can predict blastocyst formation [21-23], but it is unclear whether it can predict the clinical outcome of the blastocyst transfer. D3 low-quality embryos were 30% less likely to develop into a blastocyst, and D5 blastocysts derived from D3 low-quality embryos had a 40% lower IR [23]. Wu et al. [24] found that the low cell number of a D3 embryo was significantly associated with lower CPR and LBR for both high-quality and low-quality blastocyst transfers, among women aged <35 years. However, Herbemont et al. [25] reported that the clinical outcomes of D5 good-quality blastocyst transfers were not influenced by the quality of the D3 cleavage embryos. Li et al. [26] reported similar results. The difference between these researchers was that the former used all-quality D5 blastocysts from D3 embryos (high or poor quality), but the latter studied only high-quality D5 blastocysts from D3 embryos (high or poor quality). In this study, we compared the clinical outcomes of D5 poor-quality blastocysts and D6 high-quality blastocysts from D3 high-quality or poor-quality cleavage embryos. We found that the CPR, IR, and LBR of D5 poor-quality blastocysts and D6 high-quality blastocysts from both D3 high-quality cleavage embryos and poor-quality cleavage embryos were similar (p>0.05) (Table 2). Moreover, the CPR, IR, and LBR were similar in the blastocysts from D3 high-quality or poor-quality cleavage embryos (p>0.05), based on D5 or D6 (Table 3). These results suggest that blastocyst selection for embryo transfer should be based on blastocyst criteria in FET cycles.
One limitation of the study was its retrospective, single-center, and observational study design. Another limitation was that some patient information, such as hormone levels, antral follicle count, endometrial receptivity, and treatments before OPU and ET, was not included.
In conclusion, the clinical outcomes of D5 poor-quality blastocysts and D6 high-quality blastocysts were similar. This suggests that the developmental speed of the embryo might be more important than embryo quality in predicting the clinical outcomes of SBT in FET cycles.
Notes
Conflict of interest
No potential conflict of interest relevant to this article was reported.
Author contributions
Conceptualization: LG. Data curation: GLZ. Formal analysis: TYS. Methodology: GLZ. Project administration: SL. Visualization: MXJ. Writing–original draft: GLZ. Writing–review & editing: LG.