Consecutive versus concomitant follicle-stimulating hormone and highly purified human menopausal gonadotropin: A milder response but better quality
Article information

Abstract
Objective
This study investigated the impact of two stimulation protocols using highly purified human menopausal gonadotropin (HP-hMG) on the endocrine profile, follicular fluid soluble Fas levels, and outcomes of intracytoplasmic sperm injection (ICSI) cycles.
Methods
This prospective clinical trial included 100 normal-responder women undergoing ovarian stimulation for ICSI; 55 patients received concomitant follicle-stimulating hormone (FSH) plus HP-hMG from the start of stimulation, while 45 patients received FSH followed by HP-hMG during mid/late follicular stimulation. The primary outcome was the number of top-quality embryos. The secondary outcomes were the number and percentage of metaphase II (MII) oocytes and the clinical pregnancy rate.
Results
The number of MII oocytes was significantly higher in the concomitant protocol (median, 13.0; interquartile range [IQR], 8.5–18.0 vs. 9.0 [8.0–13.0] in the consecutive protocol; p=0.009); however, the percentage of MII oocytes and the fertilization rate were significantly higher in the consecutive protocol (median, 90.91; IQR, 80.0–100.0 vs. 83.33 [75.0–93.8]; p=0.034 and median, 86.67; IQR, 76.9–100.0 vs. 77.78 [66.7–89.9]; p=0.028, respectively). No significant between-group differences were found in top-quality embryos (p=0.693) or the clinical pregnancy rate (65.9% vs. 61.8% in the consecutive vs. concomitant protocol, respectively). The median follicular fluid soluble Fas antigen level was significantly higher in the concomitant protocol (9,731.0 pg/mL; IQR, 6,004.5–10,807.6 vs. 6,350.2 pg/mL; IQR, 4,382.4–9,418.4; p=0.021).
Conclusion
Personalized controlled ovarian stimulation using HP-hMG during the late follicular phase led to a significantly lower response, but did not affect the quality of ICSI.
Introduction
Although the role of follicle-stimulating hormone (FSH) in in vitro fertilization (IVF) cycles has been well established, and FSH alone can lead to successful follicular development, the role of luteinizing hormone (LH) supplementation in the mid-follicular phase in ovarian stimulation remains debatable [1,2]. A recent study found that FSH induced LH receptor expression on granulosa cells, especially in pre-ovulatory follicles (≥10 mm) [3]. LH normally is not present in follicular fluid (FF) until the mid/late follicular phase, and excessive levels of LH in early follicular stimulation may decrease the mitotic activity of granulosa cells, potentially leading to degenerative changes due to increased intrafollicular androgen levels. LH excess may also affect the fertilization, implantation, and pregnancy rates [4,5]. Human menopausal gonadotropin (hMG) preparations have progressively become problematic as the urine of aging menopausal women has been found to have markedly higher FSH than LH levels; therefore, other sources of LH activity became important. Highly purified hMG preparations use human chorionic gonadotropin (hCG) of either pituitary or trophoblastic origin as a source of LH bioactivity, and hCG provides a more potent effect than LH [6,7]. LH activity driven by hCG improves the ovarian response to FSH stimulation and enhances the implantation potential of embryos [8].
FF provides an important microenvironment for the proper development of oocytes [9]. Its components reflect the metabolic state of ovarian granulosa and theca cells [10]. Soluble Fas (Apo-1, CD95) is a cell-surface molecule that is a member of the tumor necrosis factor family and mediates apoptosis [11]. Apoptosis is involved in the physiology of reproduction, including follicular atresia, endometrial proliferation implantation, blastocyst attachment, and placental proliferation [12,13]. It was found that lower levels of FF soluble Fas antigen (sFas) were associated with higher pregnancy rates, as sFas may support embryo implantation, prevent damage of the embryo, and affect blastocyst attachment and the proliferation of placenta cells [14,15]. However, other studies stated that lower concentrations of FF sFas were associated with more apoptosis in stimulated cycles and resulted in poor quality of oocytes and embryos [9]. No studies have evaluated the effect of different gonadotropin protocols on follicular apoptosis. The hypothesis of the present study was that the LH activity of highly purified human menopausal gonadotropin (HP-hMG) from the early follicular phase might be harmful to oocyte development, and sFas was used as a marker of follicular apoptosis that may occur as a result of adding LH from the early follicular phase.
Methods
1. Study design and subjects
One hundred patients were recruited from private IVF/intracytoplasmic sperm injection (ICSI) centers in Alexandria, Egypt, between April 2020 and June 2021. The subjects were recruited by convenience sampling. Fifty-five consecutive patients at IVF centers who matched the inclusion criteria received conventional concomitant protocol. Forty-five patients with cross-matched criteria started the new consecutive protocol after agreement of their physicians. Before the couples were enrolled into our study, they underwent a standard protocol of investigations, including a semen analysis, ovarian reserve testing, and transvaginal ultrasonography for uterine assessment and an antral follicular count.
The inclusion criteria were women aged ≤37 years with regular ovulatory cycles and an expected normal response if undergoing ICSI with pituitary downregulation. The exclusion criteria were women with polycystic ovarian syndrome and poor responders according to the Bologna criteria [16]. The power was 96.8%, with an effect size of 0.8 calculated based on the number of oocytes in group 1 versus group 2 (results of the current study) using the G*Power program [17].
This study protocols were approved by the local Ethics Committee of Alexandria University. Every patient was extensively counseled and provided written informed consent prior to participating in the study.
2. Ovarian stimulation protocol
In group 1 (concomitant protocol), 55 patients received concomitant FSH and HP-hMG from the start of stimulation. In group 2 (consecutive protocol), 45 patients received FSH only at the beginning of ovarian stimulation, followed by the addition of HP-hMG when the follicles reached 12 mm or more. HP-hMG was continued until the day of triggering of ovulation. FSH was administered as recombinant FSH (rFSH), follitropin alfa (Gonal-F; Merck Serono, Geneva, Switzerland), (Gonapure (Minapharm Pharmaceuticals, 10th of Ramadan City, Egypt), or highly purified urofollitropin (Fostimon; IBSA Institut Biochimique SA, Lugano, Switzerland). HP-hMG was administered as either Meriofert (IBSA Institut Biochimique SA) or Menopur (Ferring Pharmaceuticals, Saint-Prex, Switzerland). The doses of gonadotropins were individualized according to the patient‘s age, body mass index, and previous response to ovulation stimulation, and ranged from 225 IU to 300 IU daily.
Pituitary down-regulation was done by either a gonadotropin-releasing hormone (GnRH) long agonist protocol using triptorelin acetate 0.1mg (Decapeptyl; Ferring Pharmaceuticals) or by a GnRH antagonist protocol, with a daily dose of subcutaneous cetrorelix (Cetrotide 0.25 mg, Merck Serono) on days 5–6 of stimulation. The ovarian response was monitored by the serum estradiol (E2) concentration using COBAS e411 (Roche Diagnostics, Mannheim, Germany). and the diameter of follicles measured by transvaginal ultrasonography. Once the leading follicle reached 18 mm in diameter, ovulation was triggered using 1,000 IU of hCG.
Oocyte retrieval was done using transvaginal ultrasonography 36 hours after triggering ovulation, followed by ICSI for mature oocytes 2–4 hours later. Fertilization and cleavage were assessed and the embryos were classified according to their morphological appearance. Embryos were transferred on day 4 or 5. The luteal phase was supported with a daily 100-mg dose of progesterone in oil intramuscularly and vaginal suppositories (400 mg twice daily) starting on the day of oocyte retrieval. Pregnancy was assessed 14 days after embryo transfer by analyzing the serum hCG level. Clinical pregnancy was defined by the presence of a gestational sac on transvaginal ultrasonography 5–7 weeks after embryo transfer.
3. Measurement of sFas in FF
FF samples were aspirated from large follicles (≥16 mm) at the time of oocyte retrieval, centrifuged immediately at 1,200 rpm for 10 minutes at room temperature to remove cellular contents and debris, and then the supernatant was collected and stored at –80° until assayed. FF was assessed for quantitative determination of sFas as a marker of oocyte apoptosis using a sandwich enzyme-linked immunosorbent assay (Human sFas/TNFRSF6, Quantikine; R&D Systems, Minneapolis, MN, USA) [18]. A monoclonal antibody specific for sFas was pre-coated on each well. Diluent RD 1-8 was added to each well. The FF samples were thawed at room temperature, and centrifuged at 3,000 rpm for 10 minutes. The supernatant was diluted 10-fold prior to the assay using 25 μL of sample + 225 μL of Calibrator Diluent RD5L (diluted 1:2). Samples (100 μL) were added to each well and incubated for 2 hours at room temperature. Then wells were washed by buffer (400 μL) three times for a total of four washes and aspirated. 200 μL of human Fas conjugate were added to each well, followed by incubation for another 2 hours at room temperature. The aspiration/wash was repeated. Substrate solution (200 μL) was added to each well, followed by incubated for 30 minutes at room temperature under protection from light. Stop solution (50 μL) was added to each well. The color in the wells changed from blue to yellow. The optical density (OD) of each well was determined within 30 minutes, using a micro-plate reader set to 450 nm and 540 nm, and then the readings at 540 nm were subtracted from those at 450 nm to correct for optical imperfections in the plate (OD 450 nm–OD 540 nm–blank 0.013). The corrected OD was plotted on a curve and the resultant concentration was multiplied by 10 to obtain the sFas level in picograms per milliliter (Figure 1).
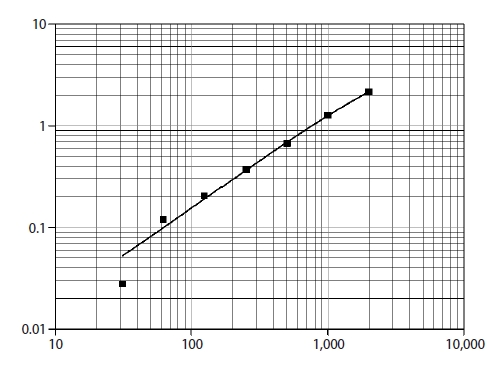
Human soluble Fas antigen (sFas) concentration.
4. Outcomes
The primary outcome was the number of top-quality embryos. The secondary outcomes were the number and percentage of metaphase II (MII) oocytes and the clinical pregnancy rate.
5. Statistical analysis
Data were analyzed using IBM SPSS ver. 20.0. (IBM Corp., Armonk, NY, USA). Qualitative data were described as numbers and percentages. The Kolmogorov-Smirnov test was used to verify the normality of distribution. Quantitative data were described using the range (minimum and maximum), mean, standard deviation, or median and interquartile range (IQR), as appropriate. A p-value <0.05 was considered to indicate statistical significance. the statistical analyses were carried out using the Mann-Whitney test, the Fisher exact test, the chi-square test, and the Student t-test. The Pearson coefficient was calculated to evaluate correlations between two normally distributed quantitative variables.
Results
No significant differences were found in the baseline characteristics between the two groups, as shown in Table 1. Basal hormone levels (day 2 LH and E2) and hormone levels on the day of triggering (LH, E2, progesterone, and hCG) were not significantly different between the two groups (Table 2). The median serum progesterone level on the day of triggering was 0.63 ng/mL in the concomitant protocol and 0.7 ng/mL in the consecutive protocol (p=0.667). The median value of serum hCG was 0.48 mIU/mL in the concomitant protocol and 0.60 mIU/mL in the consecutive protocol (p=0.098). When comparing the two groups regarding the parameters of ICSI outcomes (Table 2), the duration of treatment was significantly shorter with the concomitant protocol, which may have been because higher doses of gonadotropins were used. With the consecutive protocol, significantly fewer oocytes were retrieved, but there was a higher percentage of MII oocytes and a higher fertilization rate, which may be explained by apoptosis of small and medium-sized follicles while larger follicles remained unaffected. However, there were no statistically significant differences between the two groups in the number of top-quality embryos or the clinical pregnancy rate. A subgroup analysis according to the GnRH analogue used in the concomitant and consecutive protocols is illustrated in Tables 3 and 4, respectively. Univariate analysis was done between serum hCG on the day of triggering and the total dose of HP-hMG, and a significant positive correlation was observed in group 1 (r=0.63, p<0.001) (Figure 2); this was attributed to the fact that the LH source in HP-hMG is mainly of hCG origin. There were no cases of moderate or severe ovarian hyperstimulation syndrome in both groups. The FF level of sFas (an apoptotic marker) was significantly higher in group 1 (median, 9,731.0 pg/mL; IQR, 6,004.5–10,807.6 pg/mL) than in group 2 (median, 6,350.2 pg/mL; IQR, 4,382.4–9,418.4 pg/mL; p=0.021); an explanation for this may be that more oocytes were rescued from apoptosis in the concomitant protocol. In The subgroup analysis, there was no statistically significant difference between sFas levels in patients with different causes of infertility. We did not find a correlation between the FF sFas and serum hCG levels on the day of triggering. There was no significant correlation between FF sFas and the fertilization rate (r=0.088, p=0.44).
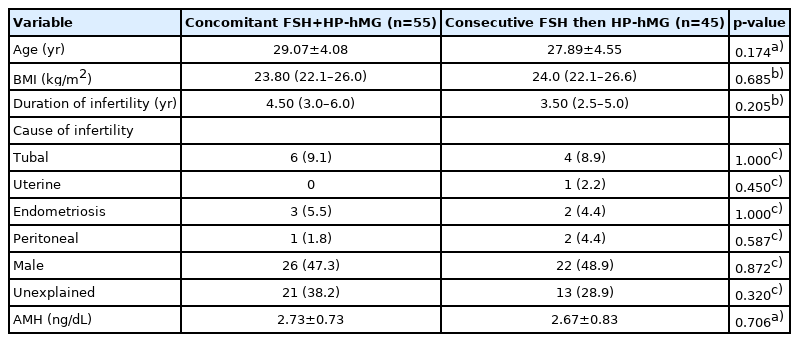
Demographic characteristics of women receiving early or late HP-hMG

Endocrine profile and cycle characteristics and outcomes in both groups
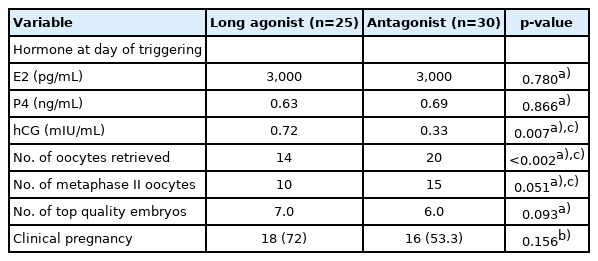
Comparison according to the GnRH analogue used in the concomitant protocol
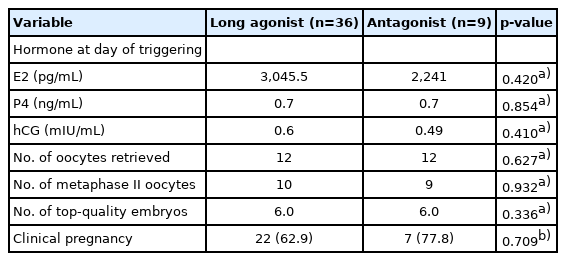
Comparison according GnRH analogue in consecutive protocol

Scatter plot showing correlation between total dose highly purified human menopausal gonadotropin (HP-hMG) and serum human chorionic gonadotropin (HCG) measured at the day of trigger.
Discussion
LH plays a critical role in the follicular phase during ovulation induction. When a growing follicle reaches 10 mm, LH can stimulate granulosa cell function [19]. Most studies have compared rFSH versus HP-hMG throughout the protocol. Several meta-analyses have compared the effects of rFSH and HP-hMG, and the results were inconclusive [20-23]. In this study, we implemented a more personalized protocol for HP-hMG either from the beginning of ovarian stimulation or the late follicular phase to follow the physiology of the follicular phase. Kan et al. [8] stated that the addition of HP-hMG to rFSH on the day of GnRH antagonist administration might improve the cumulative pregnancy rate in patients aged ≤30 years. However, in our results, we did not find significant difference in the cumulative pregnancy rate between the two groups.
Our results were consistent with the study of Filicori et al. [24], who added increasing doses of hCG as a source of LH activity from day 8 of stimulation (ranging from 0 IU to 50 IU, 100 IU, and 200 IU) with declining FSH and found that preovulatory E2 levels did not differ in all treatment groups. The number of small (≤10 mm) preovulatory follicles was significantly reduced in all patients who received exogenous hCG. In this study, we found a lower number of oocytes with the sequential protocol; this selective regression of smaller follicles seems to be an advantageous process. This is the first study to show that LH activity from late follicular stimulation increases FF sFas levels. LH may lead to atresia of small follicles; this modulates the response to involve a lower number of oocytes but a higher oocyte quality. The role of sFas as an apoptotic marker that predicts oocyte quality was debatable. Sarandakou et al. [18] concluded that sFas plays a critical role in controlling oocyte maturation, as the concentration of FF sFas was higher in follicles with MII oocytes. In agreement with their results, we found that FF sFas was significantly higher in group 1, in which there was higher number of follicles at oocyte retrieval. In contradiction to work that was done by Abdelmeged et al. [15], we found that FF sFas was not related to the etiology of infertility or pregnancy. They reported that the levels of sFas in serum and FF varied according to patients’ diagnosis, with significantly higher levels in patients with uterine factor infertility and low concentrations in the serum and FF of patients with male factor and unexplained infertility. However, in this study, there was only 1 patient with uterine factor infertility. Abdelmeged et al. [15] found a significant correlation between the levels of sFas in the serum of pregnant and non-pregnant women. However, in accordance with their findings, we observed no relationship between FF sFas and the fertilization rate, which is also consistent with the results of Onalan et al. [25] and Jose de los Santos et al. [26], who did not find correlations between the FF sFas and the fertilization rate or the cumulative pregnancy rate.
There are very few articles that have investigated the consecutive protocol or studied follicular apoptosis with different gonadotropin protocols. All the available articles studied sFas in relation to different causes of infertility and differences between serum and FF levels, whereas no previous studies have analyzed its level in different gonadotropin protocols even though the sFas-Fas ligand system is regulated by gonadotropins. Non-randomization might have led to selection bias, but we tried to minimize this risk by matching the cases in both groups according to age, BMI, and ovarian reserve.
We concluded that personalized controlled ovarian stimulation using consecutive FSH and HP-hMG resulted in lower apoptotic activity and a lower number of oocytes, with a higher fertilization rate. Neither the concomitant nor consecutive protocol resulted in accumulation of serum hCG or a rise in serum progesterone levels. Neither protocol caused moderate or severe ovarian hyperstimulation syndrome.
Notes
Conflict of interest
No potential conflict of interest relevant to this article was reported.
Author contributions
Conseptualization: HAM. Data curation; OY, NAED. Formal analysis; OYA. Methodology; HAM. Project administration; HAM. Visualization; OYA. Writing–original draft: OYA. Writing–review & editing; HAM, AFMA, MSS, NAED.
Acknowledgements
The authors would like to thank the staff and embryologists at the ICSI centers where the study was done, for their help with data collection and follicular fluid sample collection.