Identification of microRNAs and their target genes in the placenta as biomarkers of inflammation
Article information

Abstract
Objective
Recently, microRNA (miRNA) has been identified both as a powerful regulator involved in various biological processes through the regulation of numerous genes and as an effective biomarker for the prediction and diagnosis of various disease states. The objective of this study was to identify and validate miRNAs and their target genes involved in inflammation in placental tissue.
Methods
Microarrays were utilized to obtain miRNA and gene expression profiles from placentas with or without inflammation obtained from nine normal pregnant women and 10 preterm labor patients. Quantitative real-time polymerase chain reaction and Western blots were performed to validate the miRNAs and differentially-expressed genes in the placentas with inflammation. Correlations between miRNA and target gene expression were confirmed by luciferase assays in HTR-8/SVneo cells.
Results
We identified and validated miRNAs and their target genes that were differentially expressed in placentas with inflammation. We also demonstrated that several miRNAs (miR-371a-5p, miR-3065-3p, miR-519b-3p, and miR-373-3p) directly targeted their target genes (LEF1, LOX, ITGB4, and CD44). However, some miRNAs and their direct target genes showed no correlation in tissue samples. Interestingly, miR-373-3p and miR-3065-3p were markedly regulated by lipopolysaccharide (LPS) treatment, although the expression of their direct targets CD44 and LOX was not altered by LPS treatment.
Conclusion
These results provide candidate miRNAs and their target genes that could be used as placental biomarkers of inflammation. These candidates may be useful for further miRNA-based biomarker development.
Introduction
Preterm labor (PTL) is defined as early labor that begins before the 37th week of pregnancy. Preterm birth via early labor is one of the most common complications of pregnancy and can cause neonatal mortality and morbidity. Although some diagnostic methods, such as risk scoring, cervical length measurements, and biochemical testing, are currently used to diagnose PTL [1], they have low sensitivity. Drugs, such as corticosteroids and tocolytics, are used to prevent premature birth, but these medications can also have serious side effects in the fetus and mother [2]. Therefore, significant limitations exist regarding the currently available methods of diagnosing and treating PTL.
PTL is more likely in women with multiple pregnancies, and can be caused by chronic diseases such as diabetes, hypertension, and infection. However, inflammation is the only process for which a causal relationship with the pathogenesis of PTL has been identified [3,4]. Thus, the identification of inflammatory factors closely related to disease might reveal biomarkers that could be used to prevent PTL or to predict its prognosis. Various biomarkers related to inflammation, including C-reactive protein [5,6] and fetal fibronectin [7], that can be detected in maternal serum or amniotic fluid have been identified as possible predictors of PTL. Romero et al. [8] demonstrated that increased levels of CXCL10 and interleukin-6 were associated with chronic or acute chorioamnionitis, respectively. However, no biomarker has been consistently used to predict PTL because of the absence of correlations, inaccurate predictions, or excessive time required to perform the analysis. Therefore, it is essential to discover more effective and reliable biomarkers to predict PTL
MicroRNAs (miRNAs) are small non-protein-coding RNAs (~22 nucleotides). In general, miRNAs that base-pair with their target mRNAs can negatively regulate gene expression by inhibiting the target mRNAs or translation, depending on the degree of complementarity between the miRNA and its target [9,10]. In addition, miRNAs can positively regulate gene expression by affecting promoter activity or translational activity [11,12]. One miRNA can influence the expression of multiple genes by this mechanism. The role of a specific miRNA depends on how it regulates its target gene.
Recently, miRNAs have been explored as diagnostic markers and new therapeutic targets of diseases because they are related to various biological processes, including angiogenesis, cell proliferation, invasion, and cell death. They can be easily detected in tissues and all body fluids, including blood [13-15]. In addition, significant differences in miRNA expression exist between tissues involved in term labor and PTL [16,17]. Differential expression of Dicer, one of the major miRNA-processing enzymes, has been reported in reproductive tissues, such as the amnion, decidua, and placenta, suggesting that miRNA is closely related to pregnancy and parturition [18]. Recent microarray research has reported that alterations in miRNA expression were closely associated with various pregnancy-related disorders, such as PTL [17,19,20]. However, prior microarray studies have not reported the exact functional targets of the relevant miRNAs. In addition, several studies have shown that miRNAs may exhibit mismatches with their expected target genes [21,22]. Therefore, the objectives of this study were to identify the expression of miRNAs and their target genes in term and preterm placentas with or without inflammation and to confirm the correlations between miRNAs and their predicted target genes.
Methods
1. Placenta samples
The collection of placental tissues and their use for research purposes were approved by the Institutional Review Board of Seoul National University College of Medicine, Seoul, Korea (IRB No. H-1105- 045-361). All patients provided written informed consent prior to sample collection. Placental tissues were collected from women who delivered at term (>35 gestational weeks) and preterm (≤35 gestational weeks). Term placentas were divided those without inflammation (term (–), n=6) or term with inflammation (term (+), n=2). Preterm placentas were divided into those without inflammation (PTL (–), n=3) or preterm with inflammation (PTL (+), n=2). Placentas with inflammation were diagnosed with acute choriodeciduitis, amnionitis. Normal placentas, delivered at term without inflammation, were utilized as controls (Table 1).

Detailed clinical characteristics of pregnant women with or without preterm labor
2. Cell culture
HTR-8/SVneo trophoblast cells (a trophoblast cell line) were used for the in vitro studies. The cells were maintained at 37°C in 5% CO2. The culture medium was RPMI-1640 (Gibco, Grand Island, NY, USA) supplemented with 5% fetal bovine serum (FBS; Gibco) and 1% penicillin-streptomycin (Gibco). HeLa cells (a cervical cancer cell line) were cultured with Dulbecco’s modified Eagle medium (Gibco) containing 5% FBS (Gibco) and 1% penicillin-streptomycin (Gibco).
3. Lipopolysaccharide treatment and miRNA transfection
The HTR-8/SVneo trophoblast cells were adjusted to 1×10⁶ cells/ dish on 100-mm dishes (Thermo Fisher Scientific, Roskilde, Denmark). The culture medium was RPMI-1640 (Gibco) containing 5% FBS (Gibco), 1% penicillin-streptomycin (Gibco), and 20 ng/mL lipopolysaccharide (LPS; Sigma-Aldrich, St. Louis, MO, USA). After 24 hours, the cells were harvested using trypsin (Sigma-Aldrich) and Dulbecco’s phosphate-buffered saline (DPBS; Thermo Scientific Hyclone, Minneapolis, MN, USA).
Two miRNAs (miR-373-3p and miR-3065-3p) were transfected into the HTR-8/SVneo trophoblast cells utilizing Lipofectamine 2000 (Invitrogen, Carlsbad, CA, USA). Scrambled miRNA (5’-CCUCGUGCCGUUCCAUCAGGUAGUU- 3’) was transfected as a negative control (NC; Genolution, Seoul, Korea). These cells were plated onto a 100-mm culture dish (Thermo Fisher Scientific) at a density of 1×10⁶ cells/dish. The cells were cultured in Opti-MEM (Gibco) containing 20 ng/mL LPS (Sigma-Aldrich), 30 nM miRNA, and Lipofectamine 2000 (Invitrogen) for miRNA transfection. At 24 hours posttransfection, the cells were trypsinized with trypsin/ethylenediaminetetraacetic acid (EDTA; Sigma-Aldrich) after washing with DPBS (Thermo Scientific Hyclone).
4. Tissue collection and RNA extraction
The placental tissues were randomly collected from the central area of placenta and stored in liquid nitrogen. Total RNA was extracted from the placental tissue utilizing Trizol (Molecular Research Center Inc., Cincinnati, OH, USA) according to the manufacturer’s instructions with slight modifications. Briefly, after homogenization, the tissues were mixed with 1 mL of Trizol (Molecular Research Center Inc.) and allowed to stand for 10 minutes at room temperature. After adding 0.5 mL of chloroform (Sigma-Aldrich), the sample was then shaken vigorously for 10 seconds. It was then allowed to stand for 10 minutes at room temperature, followed by centrifugation at 13,000 rpm for 15 minutes at 4°C. The supernatant was transferred to a new tube and mixed with 0.4 mL of isopropanol (Merck, Kenilworth, NJ, USA) and allowed to stand at room temperature for 10 minutes. After centrifugation at 13,000 rpm for 15 minutes at 4°C, the RNA pellet was washed with 1 mL of 75% ethanol and centrifuged at 13,000 rpm for 5 minutes at 4°C. The RNA pellet was then air-dried for 10 minutes and dissolved in diethylpyrocarbonate-treated (Invitrogen) water at 65°C for 5 minutes. The total RNA was stored at –80°C until further analysis. The RNA was used to confirm the expression of mRNA and miRNA by gene array and quantitative real-time polymerase chain reaction (qRT-PCR) analyses.
5. Microarrays
The total RNA quality and quantity were assessed with an Agilent Bioanalyzer 2100 (Agilent Technologies, Santa Clara, CA, USA). Gene and miRNA expression was analyzed using a GeneChip Affymetrix Primeview array (Affymetrix, Santa Clara, CA, USA) and an Affymetrix miRNA 4.0 array, respectively. For the gene expression array, biotinylated complementary RNA (cRNA) were produced from 500 ng of total RNA using the standard Affymetrix (Expression Analysis Technical Manual, 2001, Affymetrix) protocol. After fragmentation, 12 μg of cRNA was incubated with the GeneChip Human Genome Array for 16 hours at 45°C. The GeneChip was rinsed and dyed using an Affymetrix Fluidics Station 450. The GeneChip was scanned with an Affymetrix GeneChip Scanner 3000 7G. For the miRNA expression array, alkalinized cRNAs were produced from 1 μg of total RNA, following the standard Affymetrix protocol. The GeneChip was scanned with an Affymetrix miRNA 4.0 array (Affymetrix). Data analysis was performed using robust multichip analysis (RMA) normalization and RMA-detection above background normalization (miRNA) with the Affymetrix default analysis settings and global scaling as a normalization method. The mean target intensity was arbitrarily set to 100 in each array. The normalized and log-transformed intensity values of the genes and miRNA were analyzed with GeneSpring GX 13.0 (Agilent Technologies). The fold-change, calculated by dividing the log-transformed intensity values by the control value, was arranged so that a minimum of 150% upregulation compared to the control group and a maximum of 66% downregulation compared to the control group could be identified. Hierarchical clustering data were obtained by GeneSpring GX 13.0 (Agilent Technologies). The clustering algorithms included Euclidean distance and average linkage.
6. Prediction of miRNA targets and pathway analysis
miRNA targets were predicted using a 95% context percentile based on the TargetScan6.2 database (http://www.targetscan.org/vert_71/, accessed March 2018) [23]. Gene ontology (GO) analysis was performed, including analyses of the cellular component, molecular function, and biological processes. Kyoto Encyclopedia of Genes and Genomes (KEGG) pathway enrichment analysis was performed for genes that were differentially expressed at 1.5-fold or higher by inflammation status in each group. The p-values <0.05 were considered to indicate statistical significance for all GO enrichment and KEGG pathway analyses.
7. Real-time PCR
The total RNA quality and quantity were determined using a NanoDrop-2000 (Thermo Fisher). Gene and miRNA expression was analyzed using the miRNA synthesis kit and FastStart Universal SYBR Green Master Mix (Roche Applied Science, Basel, Switzerland). The amount of total RNA used was 500 ng. The miRNA was analyzed following the protocol of the miRNA synthesis kit. Briefly, miRNA cDNA was synthesized at 37°C for 1 hour, followed by incubation at 85°C for 5 seconds. The thermocycling conditions for miRNA expression involved an initial denaturation at 95°C for 5 minutes, 40 cycles of denaturation at 95°C for 10 seconds, and annealing at 60°C for 5 seconds. The dissociation curve conditions were 95°C for 1 minute, 55°C for 30 seconds, and 95°C for 30 seconds. The cDNA synthesis solution included 20 mM oligo-dT (20-mer), 10 nM dNTP mix (Solgent Co., Daejeon, Korea), 5× first-strand buffer (Invitrogen), 0.1 M dithiothreitol (Invitrogen), RNase-out (Invitrogen), and superscript III RT (Invitrogen). Firststrand cDNA was synthesized at 65°C for 5 minutes, followed by incubation at 4°C for 1 minute. Second-strand cDNA was synthesized at 50°C for 1 hour and 72°C for 15 minutes. The reaction was then paused at 4°C. For gene analyses, 20 pmol of primers and FastStart Universal SYBR Green Master Mix (Roche Applied Science) were used. The thermocycling conditions for mRNA expression analysis were an initial denaturation at 95°C for 5 minutes, 40 cycles of denaturation at 95°C for 5 seconds, and annealing at 60°C for 30 seconds. The primer sequences used for miRNA and gene expression analyses are listed in Table 2.
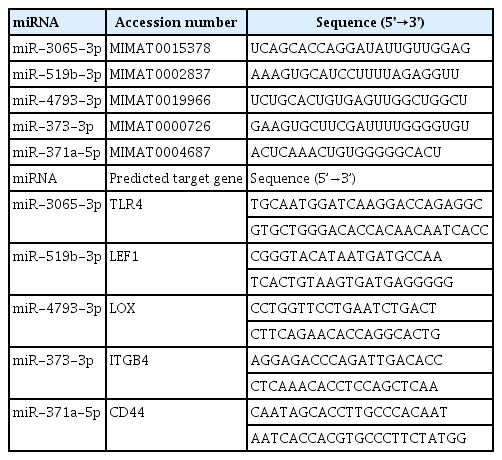
Sequence of used primer for qRT-PCR
8. Western blot
To extract placental protein, the tissue was homogenized in RIPA buffer (50 mM Tris-HCL, pH 7.6, 150 mM NaCl, 1% NP40, 0.25% deoxycholic acid, 0.1% sodium dodecyl sulfate [SDS], 1 nM EGTA, 1 mM EDTA, 10 mM NaF, and 1 mM NA3VO4) containing protease inhibitors and a phosphatase inhibitor. After two rounds of sonication for 2 seconds each, the lysate was stored at 4°C for 10 minutes and centrifuged at 13,000 rpm for 30 minutes at 4°C. The total protein concentration was quantified with a BCA assay kit (Thermo Scientific, Rockford, IL, USA). The proteins were subjected to 12% SDS-polyacrylamide for 120 minutes at 100 V and transferred onto polyvinylidene difluoride membranes (Bio-Rad, Hercules, CA, USA) for 90 minutes at 100 V. After blocking with 5% bovine serum albumin (BSA; Amresco, Solon, OH, USA) at room temperature for 1 hour, the membrane was incubated with CD44 (1:1,000, Mo), LOX (1:1,000, Rb), and/or GAPDH (1:3000, Rb) primary antibodies diluted in 5% BSA overnight at 4°C. After washing with PBS three times (5 minutes for each wash), the membrane was incubated with a horseradish peroxidase-labeled secondary antibody (goat anti-mouse immunoglobulin G [IgG] or goat anti-rabbit IgG; Bio-Rad) diluted in 5% BSA at room temperature for 1 hour. The protein bands on the membranes were detected using a Clarity Western ECL substrate (Bio-Rad), and captured with c-digit (LI-COR, lincoln, NE, USA). The intensity of the bands was measured with ImageJ software.
9. Cloning
The 3’ untranslated regions (UTRs) of the gene sequences targeted by miRNAs were identified by Miranda (http://www.microrna.org/microrna/home.do) [24] and used to design oligonucleotides for the luciferase assay. The mRNA-3’ UTR region fragments were amplified using PCR. The fragment synthesis solution contained 10× Taq buffer (Solgent Co.), 10 mM dNTP mix (Solgent Co.), and h-taq (Solgent Co.). The synthesis conditions were an initial denaturation at 95°C for 5 minutes, 35 cycles of denaturation at 95°C for 5 seconds, annealing at 60°C for 30 seconds, extension at 72°C for 1 minute, and a pause at 4°C. Then, the PCR product was purified using a PCR purification kit (Bioneer, Daejeon, Korea). The product was inserted into multiple cloning sites of a pmirGLO vector (Promega, Madison, WI, USA) that was linearized by a restriction enzyme. The linearized pmirGLO vector was mixed with the PCR product and ligase using a ligation protocol. The complete pmirGLO vector was transformed into competent cells and spread onto an ampicillin-containing agar plate. After 24 hours of incubation, colonies were selected and cultured in ampicillin-containing broth. Plasmid DNA was extracted using a plasmid mini extraction kit (Bioneer). The fidelity of the plasmid DNA sequence was confirmed by DNA sequencing.
10. Luciferase assay
miRNA and a cloning vector were transfected into HeLa cells using Lipofectamine 2000 to confirm binding of the miRNA with the mRNA- 3’ UTR. The cells were adjusted to a density of 5×10⁴ cells/well in 24-well plates. The next day, the medium was changed to Opti-MEM containing miRNA, the vector, and Lipofectamine until 80% confluency was reached. Each group was transfected with only the pmir-GLO vector (at 150 ng/μL) or a combination of the vector (150 ng/μL) and 30 nM miRNA mimic or negative control miRNA. Luciferase activity was analyzed using the Dual-Luciferase Reporter Assay System (Promega) according to the manufacturer’s protocol. Twenty-four hours later, the culture plate supernatant was removed and the surface was washed with DPBS. The cells were harvested with 1× positive lysis buffer to prepare cell lysates. Positive lysis buffer (100 μL/ well) was added to the 24-well plate. The plate was then placed on an orbital shaker at room temperature for 15 minutes. The lysates (20 μL/well) were added to a 96-well white plate and luciferase assay reagent II was added (80 μL/well). After 2 minutes of incubation, the plate was read on a luminometer (BioTek, Winooski, VT, USA) to determine the level of firefly luciferase activity. Then, Stop & Glo reagent (Promega; 80 μL) was added to each well to measure Renilla luciferase activity. Luminescence was calculated as the ratio of firefly luciferase activity to Renilla luciferase activity.
11. Statistical analysis
Data from the qRT-PCR assays were analyzed by two-way analysis of variance for multiple comparisons using SigmaPlot 13.0 (Systat Software Inc. San Jose, CA, USA). The data are presented as mean± standard error. Statistical significance was considered to be present at p<0.05.
Results
1. Analysis of miRNA and target gene expression profiles in term labor and PTL placentas with or without inflammation
To identify the miRNAs and target genes involved in inflammation in term labor and PTL placentas, we divided the placentas collected from normal term and PTL patients into four groups according to their inflammation status and analyzed their miRNAs and target genes using microarrays. Then, the expression levels of miRNA and mRNA in the term (+), PTL (–), PTL (+), and term (–) groups were compared. We also matched the miRNAs to their predicted targets and analyzed genes that exhibited expression patterns opposite those obtained from the TargetScan 6.2 target prediction algorithm program. The sets of miRNAs and genes related to inflammation were identified based on GO and KEGG pathway analyses.
After excluding overlapping miRNAs in each group, we identified 187 miRNAs and 232 inflammation-related predicted target genes that were differentially expressed by 1.5-fold or more (Supplementary Tables 1 and 2). A total of 94 miRNAs and 113 predicted target genes were identified by comparing placentas with inflammation (term (+), PTL (+)) with normal placentas (term (–)) (Supplementary Table 1). A total of 133 miRNAs and 186 predicted target genes were identified by comparing PTL placentas (PTL (–), PTL (+)) with normal placentas (term (–)) (Supplementary Table 2).
We then arbitrarily selected 28 miRNAs and 25 of their predicted target genes identified in the published literature to validate the expression patterns and interactions between the miRNAs and their gene targets. A heatmap analysis of the differential expression of 28 miRNAs and 25 predicted target genes showed that the expression levels of various miRNAs and genes were altered by inflammation, regardless of the duration of pregnancy, suggesting that miRNAs and their target genes might play a major role in inflammation (Figure 1).
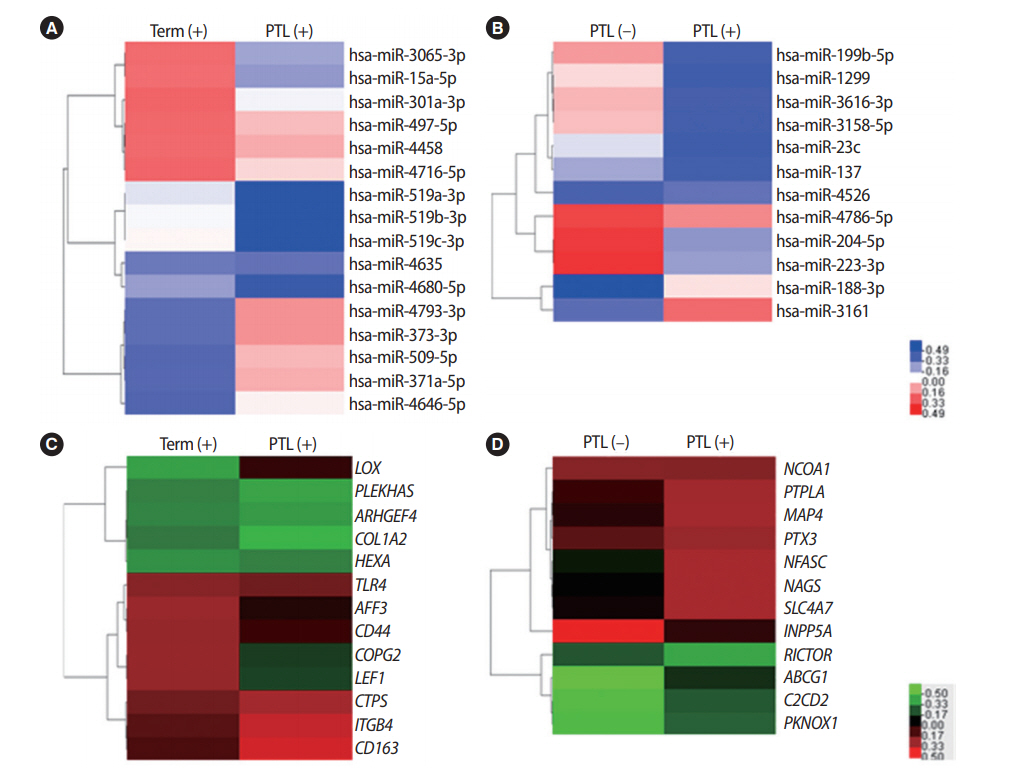
Heatmap of hierarchical clustering. Heatmaps illustrating the differentially-expressed microRNAs (miRNAs; A, B) and genes (C, D) in placentas of each group. Term with inflammation (term (+), n = 2), preterm without inflammation (PTL (–), n = 3), and preterm with inflammation (PTL (+), n = 2) compared to normal-term without inflammation (term (–), n = 6). Red represents upregulated miRNAs and genes. Blue and green represent downregulated miRNAs and genes. PTL, preterm labor.
2. Validation of miRNA and target gene expression in the placenta
Among the miRNAs/genes selected through the microarray analysis, the Toll-like receptor 4 gene (TLR4) was identified as an important factor in inflammation. TLR4 activates nuclear factor-kappa B signaling in response to LPS [25,26]. Additionally, LEF1, a mediator of the Wnt signaling family, plays critical roles in the development of B and T cells [27,28]. A gene target matching program showed that miR- 4793 and miR-371a-5p might regulate TRL4 and LEF1, respectively (Supplementary Table 1). Therefore, we first validated the expression of miR-4793, miR-371a-5p, TLR4, and LEF1 in placental samples using qRT-PCR. The expression levels of TLR4 and LEF1 were increased in placentas with inflammation (term (+)) compared to normal placentas (term (–)) (Figure 2A and B). However, unlike the microarray data, the expression levels of miRNA-4793 or miR-371a-5p in placentas with inflammation (term (+)) were not significantly different from those in normal placentas (term (–)) (Figure 2A and B). We analyzed three additional miRNAs and their targets known to be involved in immune responses using qRT-PCR. The expression levels of miR- 3065-3p, miR-519b-3p, and miR-373-3p were significantly changed by inflammation. The level of miR-3065-3p expression was significantly lower, whereas levels of miR-519b-3p and miR-373-3p expression were significantly increased in PTL placentas with inflammation (PTL (+)) compared to normal-term placentas (term (–)) (Figure 2C-E). We then confirmed the expression of LOX, ITGB4, and CD44 to verify their predicted targets. Although LOX is a target of 3065-3p, its expression was reduced by inflammation, similar to its miRNA expression pattern. The levels of ITGA4 and CD44 were also lower in PTL placentas with inflammation (PTL (+)) than in normal-term placentas (term (–)) (Figure 2C-E).

Quantitative real-time polymerase chain reaction (qRT-PCR) validation of microarray data in placental tissues for selected genes. The expression of five microRNAs (miRNAs; miR-4793, miR-371a-5p, miR-3065-3p, 519b-3p, and miR-373-3p) and their predicted target genes (TLR4, LEF1, LOX, ITGB4, and CD44) in placental samples was analyzed by qRT-PCR (A-E). Values represent mean ± standard error. Term, term delivery (> 35 gestational weeks); PTL, preterm delivery (≤ 35 gestational weeks); (–), without placental inflammation; (+), with placental inflammation. a)p< 0.05. U6 and GAPDH were used as loading controls.
3. Interactions between miRNAs and target genes in trophoblast cells
To determine whether LEF1, LOX, ITGB4, and CD44 were direct targets of miR-371a-5p, miR-3065-3p, miR-519b-3p, and miR-373-3p, respectively, 3’ UTR reporters for these target genes were cloned into HTR-8/SVneo cells. Reporter genes with miRNA mimics were also transfected into HTR-8/SVneo trophoblast cells. Interestingly, when treated with miRNA mimics, the luciferase activity of the expected target genes (LEF1, LOX, ITGB4, and CD44) was significantly reduced (Figure 3). These results indicate that these four miRNAs directly regulated their respective target genes.
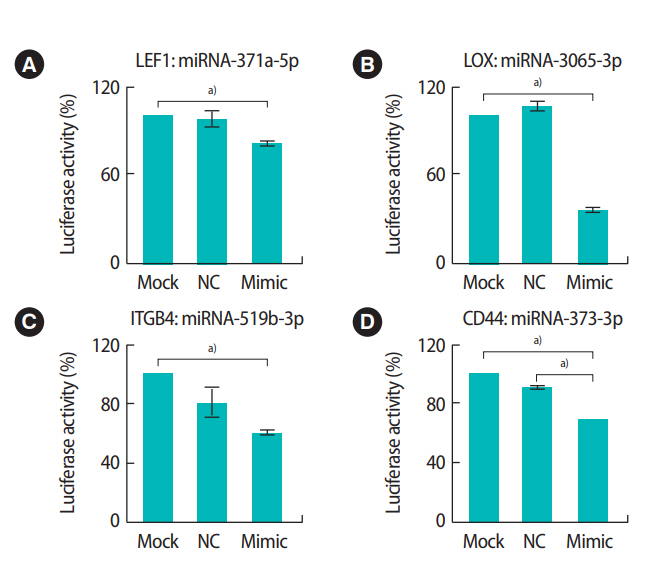
Experimental validation of predicted microRNAs (miRNAs) targets using luciferase assays. Luciferase assays were performed to validate the interaction of miRNAs with their target genes. Transient overexpression of miRNAs, including miR-371a-5p (A), miR-3065-3p (B), miR-519b-3p (C), and miR-373-3p (D), reduced the luciferase activity of 3' untranslated region reporters of their target genes (LEF1, LOX, ITGB4, and CD44, respectively). Values represent mean ± standard error. NC, negative control. a)p< 0.05.
4. Alteration in miRNA expression in response to LPS treatment
We further analyzed the expression of miRNAs and their target genes in HTR-8/SVneo cells after LPS treatment. A computational analysis of the expected target sites using Miranda revealed that the 3’ UTR region of the CD44 gene was the binding site of miR-373-3p (Figure 4A). The mRNA and protein expression levels of CD44 were significantly decreased when miR-373-3p was stably transfected into HTR-8/SVneo cells (Figure 4B-D). Additionally, the expression of miR-373-3p was significantly increased by treatment with LPS (Figure 4E). However, there was no significant difference in the expression of CD44 after LPS treatment (Figure 4F and G). Similarly, the 3’ UTR of LOX was the binding site of miR-3065-3p (Figure 5A). When the miR-3065-3p level increased, LOX mRNA and protein levels significantly decreased (Figure 5B-D). However, although the miR-3065-3p level was significantly reduced by LPS treatment, LOX expression did not change (Figure 5E-G). These results suggest that miR-373-3p and miR-3065-3p are closely related to inflammation. However, their direct target genes, including CD44 and LOX, might not be associated with inflammation.
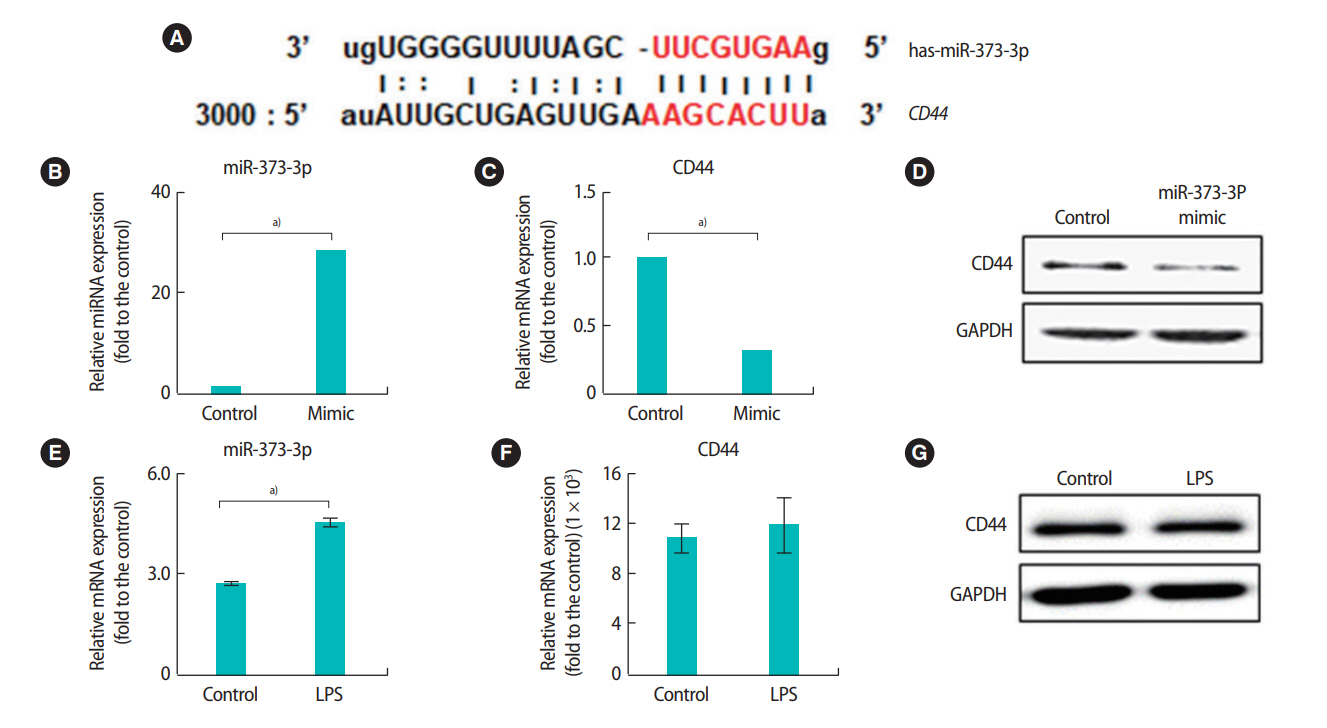
Interactions between miR-373-3p and CD44 in HTR-8/SVneo trophoblast cells and expression of miR-373-3p and CD44 following lipopolysaccharide (LPS) treatment. The 3' untranslated region (UTR) of the CD44 gene contains an microRNAs (miRNAs) binding site for miR373-3p (A). Expression of miR-373-3p (B) and CD44 mRNA (C) in HTR-8/SVneo cells after treatment with 30 nM miR-373-p was analyzed by quantitative real-time polymerase chain reaction (qRT-PCR). The protein levels of CD44 were analyzed by Western blots (D). The expression of miR-373-3p (E) and CD44 (F, G) after LPS treatment was analyzed by qRT-PCR and Western blots. Values represent mean ± standard error. a)p< 0.05. GAPDH was used as a loading control.
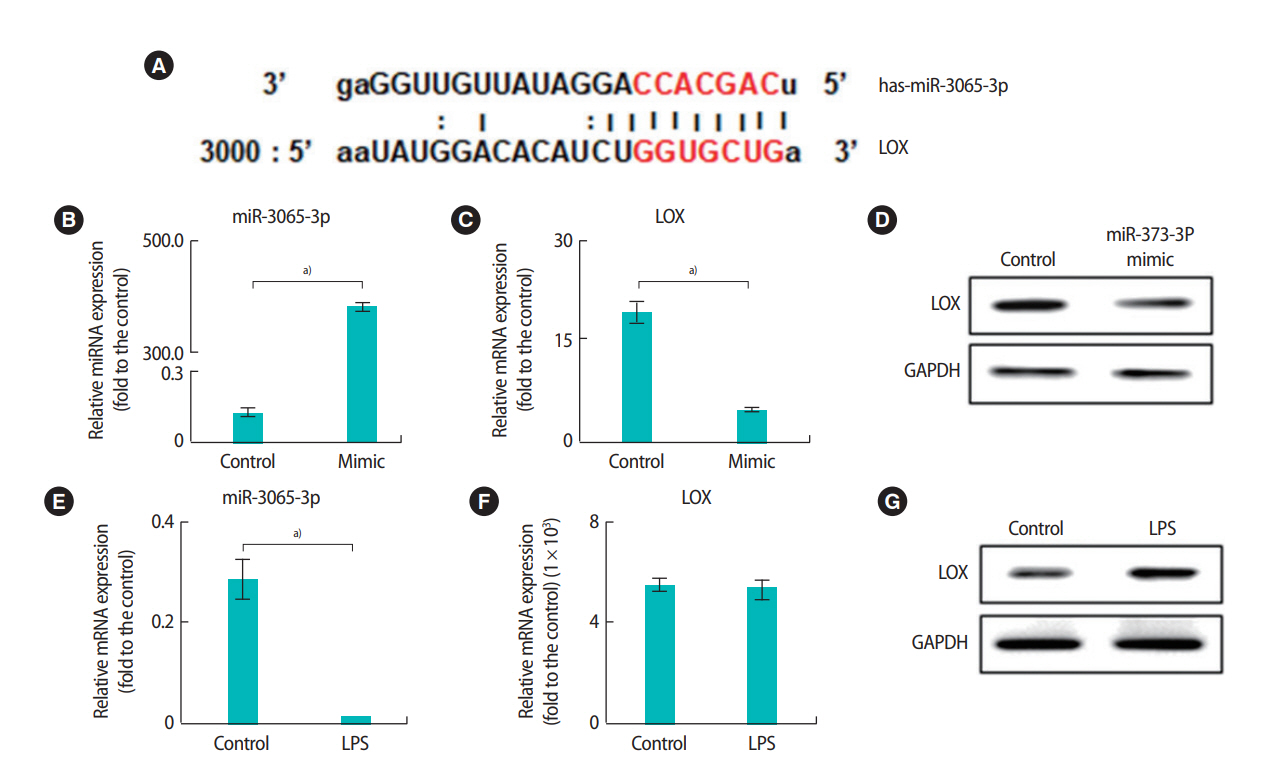
Interactions between miR-3065-3p and LOX in HTR-8/SVneo trophoblast cells and expression of miR-3065-3p and LOX following lipopolysaccharide (LPS) treatment. The 3' untranslated region of the LOX gene contains an microRNAs (miRNAs) binding site for miR-3065-3p (A). The expression of miR-3065-3p (B) and LOX mRNA (C) in HTR-8/SVneo cells after treatment with 30 nM miR-373-p was analyzed by quantitative real-time polymerase chain reaction (qRT-PCR). The protein levels of LOX were analyzed by Western blots (D). The expression of miR-3065-3p (E) and LOX (F, G) after LPS treatment was analyzed by qRT-PCR and Western blots. Values represent mean ± standard error. a)p< 0.05. GAPDH was used as a loading control.
Discussion
High-throughput analytical techniques, such as microarrays, are useful tools for identifying and profiling gene expression (including miRNA expression) on a large scale to understand the relationships between miRNA, genes, and disease [19]. In our study, several hundred miRNAs and gene changes were observed in groups classified according to inflammation status (Supplementary Tables 1 and 2). However, high-throughput analysis can result in false signals due to the screening of large numbers of expressed genes from small samples. Thus, microarray results must be validated using quantitative assays.
In this study, we validated microarray results using qRT-PCR. The qRT-PCR data showed that 3 miRNAs (miR-3065-3p, miR-519b-3p, and miR-373-3p) were significantly altered in term and preterm placentas with or without inflammation. However, the miR-4793 and 371a-5p levels in qRT-PCR were not significantly different. These results might have been due to difficulties in the analysis caused by the unique characteristics of miRNAs or differences in the analytical methods. Microarrays, in particular, have low specificity and sensitivity [29,30].
Interestingly, the expression patterns of miR-373-3p and miR-519-3p, which were altered by inflammation, were different in term and preterm placentas, although 3065-3p showed the same pattern of change according to inflammation in term labor and PTL. The difference in gestational age between term labor and PTL placentas may have affected their expression. Differential expression patterns of miRNAs and genes in placentas according to gestational stage have been demonstrated [31,32]. Gu et al. [32] demonstrated that miR-373 and miR-519b were upregulated in first-trimester placentas compared to third-trimester placentas. These results are consistent with our findings. Therefore, these results imply that miRNAs can be regulated by diverse aspects of the environment, suggesting that their functional target validation—with distinct major functions in each environment—is required before they are used as biomarkers.
Recent studies have shown that miRNAs are closely related to the pathogenesis of disease and that their various targets can be involved in PTL [16,18]. Several studies have also suggested targets for differentially-expressed miRNAs through computer predictions [16,33]. However, the computer-predicted targets only matched a portion of the global mRNA, and often contained false-positive nonfunctional targets or missed true-positive functional targets [21,22]. There is a paucity of research on precise miRNA target validation. Therefore, in this study, the interaction of target miRNA and mRNA was verified to identify the correct functional target.
The results of this study showed that miRNAs, including miR-371a-5p, miR-3065-3p, miR-519b-3p, and miR-373-3p, could directly regulate their predicted target genes selected by a prediction algorithm analysis in HTR-8/SVneo trophoblastic cells. Furthermore, reverse correlations of miR-519b-3p and miR-373-3p with their targets were found. ITGB4 and CD44 expression in the placenta was affected by inflammation and PTL. However, neither miRNA-371a-5p nor miR-3065-3p were reversely correlated with LEF1 or LOX in placental tissue. These results show the limitations of computer-generated miRNA target prediction and indicate that the expression of miRNAs and their predicted target genes may not be precisely matched in in vivo samples.
The regulatory mechanisms of miRNA expression are quite complex. miRNA expression can be controlled by a variety of intrinsic and extrinsic factors [34]. Additionally, several miRNAs can regulate a single target, or the expression of a single gene can control the expression of several miRNAs. Stephen et al. [33] suggested that miR-21, 155-5p, 146, and 146a-5p are implicated in PTL. They might regulate inflammation by regulating target genes, including TLR-4. TLRs are also implicated in the regulation of miRNAs, such as miR-107 [35]. Qiu et al. [36] demonstrated that miR-371, miR-139, miR-544, miR-145, and miR-214 could directly regulate the expression of Runx3. Several groups have demonstrated that miR-373 and miR-520c could regulate CD44 expression [37,38]. These results suggest that the modulation of miRNA target genes is accomplished by very complicated mechanisms.
Members of the TLR family, which are major pattern recognition receptors, play critical roles in inflammation through the recognition of motifs such as pathogen-associated molecular patterns, including LPS, peptidoglycan, and damage-associated molecular patterns, which are released from infected cells [39]. Kumazaki et al. [40] demonstrated that TLR4 is highly expressed in PTL placentas with chorioamnionitis and localized placental macrophages (i.e., Hofbauer cells). In addition, treatment of pregnant mice with LPS upregulated TLR4 [41], consistent with our results. In our study, TLR4 expression was higher in placentas with inflammation. However, the expression of miR-4793, which was expected to be a modulator of TLR4, was not significantly different across the various placenta samples (Figure 2).
Previous studies have shown that lysyl oxidase (LOX) is directly regulated by miR-27 and miR-30a [42,43]. LOX is a key enzyme responsible for the formation of extracellular matrix proteins, such as type I and II collagen. LOX is also regulated by tumor necrosis factor alpha, a major cytokine responsible for acute and chronic inflammation in rat cardiac fibroblasts [44]. In the present study, for the first time, we found that miR-3065-3p could directly target LOX. CD44, a glycoprotein receptor, is also highly expressed in immune cells, including macrophages, neutrophils, eosinophils, and lymphocytes [45-47]. It is a potential target for various diseases associated with inflammation [48,49]. Published studies have already shown that many targets of miR-373-3p are involved in various functions, such as migration, invasion, proliferation, and DNA repair [50]. However, the function of miR-373-3p in a variety of cancers differs depending on the target and host cells [38,51,52]. As such, miRNAs display patterns specific to different tissues or cells. Thus, it is necessary to choose the appropriate cell line in vitro to represent in vivo samples. HTR-8/SVneo cells are derived from trophoblasts, the main placental cells. We demonstrated that miR-373-3p directly targeted CD44 and that the mRNA expression of CD44 was significantly lower in miR-373-3p-transfected HTR-8/SVneo cells. Yang et al. [38] demonstrated that, although miR-373-3p and 520c did not degrade CD44 RNA, they inhibited the translation of CD44 involved in the invasion of prostate cancer via binding to the 3’ UTR of CD44. These results suggest that this mechanism is different from that involved in cancer cells.
In addition, we found that the miR-373-3p expression level was significantly higher in PTL placentas than in normal-term placentas. Whitehead et al. [53] demonstrated that miR-373 was expressed in maternal blood at a significantly higher level in the blood of PTL patients than in patients who experienced normal deliveries. In addition, miR-373 levels were very high in the maternal blood of fetuses with fetal growth restriction, whereas the basal levels in gestationmatched controls were very low. These findings are consistent with our results. However, our findings showed that neither CD44 nor LOX expression levels were altered by LPS, although the levels of miR-373-3p and miR-3065-5p were significantly modified by LPS. These in vitro results are consistent with our in vivo results. Although miRNA targets were identified, their use as independent biomarkers is limited because miRNA targets are not real, functional targets. Despite the large numbers in this study, we validated only a few target genes of miRNA at the RNA level in the matching process between miRNA and mRNA. Therefore, further research is needed to validate the exact functional target genes of miRNAs—including miR-373-3p and miR-3065-3p—at the protein level to develop potential inflammation biomarkers.
In summary, we identified miRNAs that exhibited differential expression in placentas with inflammation and elucidated the direct targets of miR-3065-3p, miR-519b-3p, miR-4793, and miR-373-3p. However, the expression of some miRNAs and their target genes were not correlated in placental tissues. Although miR-3065-3p and miR-373-3p were regulated by LPS, the expression levels of their direct targets, LOX and CD44, were not altered by LPS. These results show the limitations of using miRNA biomarkers alone and highlight the need for accurate, functional target validation and dual biomarker use.
Notes
Conflict of interest
No potential conflict of interest relevant to this article was reported.
Author contributions
Conceptualization: JSH, GJK. Data curation & Formal analysis: HYJ, SML. Funding acquistion: GJK. Methodology: HJL. Visualization: HYJ. Writing - original draft: HYJ. Writing - review & editing: SML, GJK.
Electronic Supplementary Material
Supplementary material can be found via https://doi.org/10.5653/cerm.2019.03013.
Venn diagram list in term and preterm labor
Venn diagram list in preterm labor