Comparison of male reproductive parameters in mice with type 1 and type 2 diabetes
Article information

Abstract
Objective
The differences between type 1 and type 2 diabetes mellitus (T1DM and T2DM) in terms of their adverse effects on male reproductive parameters have never been elucidated. This study aimed to distinguish between the effects of the DM types in mice treated with multiple low doses of streptozotocin (STZ) to mimic human T1DM and coadministered a high-fat diet (HFD) to mimic human T2DM.
Methods
The T1DM mice were intraperitoneally injected with STZ (40 mg/kg body weight) for 5 days. The T2DM mice received an HFD for 14 days prior to STZ injection (85 mg/kg body weight), followed by continuous feeding of an HFD. Male reproductive parameters were evaluated.
Results
The reproductive organs of the DM mice weighed significantly less than those of controls, and the seminal vesicles plus prostates of the T1DM mice weighed less than those of the T2DM mice. Increased sperm abnormalities and incomplete DNA packaging were observed in the DM groups. Sperm concentration and the proportion of normal sperm were significantly lower in the T1DM group. The seminiferous histopathology of DM mice was classified into seven types. The penises of the DM mice were smaller than those of the controls; however, tunica albuginea thickness and the amount of penile collagen fibers were increased in these mice. Round germ cells were abundant in the epididymal lumens of the mice with DM.
Conclusion
T1DM adversely affected reproductive parameters to a greater extent than T2DM.
Introduction
The worldwide prevalence of both type 1 and type 2 diabetes mellitus (T1DM and T2DM, respectively) is rapidly increasing [1,2]. Various disorders can result from T1DM and T2DM, including male reproductive dysfunction [3-8]. Diabetes mellitus has also been found to alter glucose metabolism in Sertoli cells, decrease spermatogenesis, damage testicular structure, and reduce testosterone levels [8-13]. However, the adverse effects of T1DM and T2DM on reproductive parameters have never been compared. The acrosome reaction is a specialized exocytotic process involved in the fusion and fenestration of sperm plasma and the outer acrosomal membrane after binding to the zona pellucida, resulting in an explosion of hydrolytic enzymes [14]. A precocious acrosome reaction in the epididymis and female reproductive tract is a cause of male infertility. Sperm parameters indicative of male fertility include concentration, viability, and motility [15]. Abnormal sperm morphology (either head or tail) has a direct effect on natural fertilization [15,16]. Additionally, the lysine-rich histones are replaced by testis-specific nuclear proteins before transforming into protamines to compact sperm chromatin [17]. Therefore, the decondensation and incomplete DNA packaging of mature sperm are potential indicators of sperm damage [17,18].
Several studies have induced DM in animal models to investigate the mechanisms of DM-related male infertility [19-23]. For T1DM, administration of multiple low doses of streptozotocin (STZ) has been used to induce subtoxic effects on β-cells, resulting in autoimmune insulitis [19,23-25]. For T2DM, STZ induction combined with a high-fat diet (HFD) is commonly used to mimic human T2DM [20,21,26,27]. Although several studies have compared the effects of each DM type on male fertility, such an investigation has yet to be conducted along with the examination of essential parameters. The respective effects of each DM type on representative histological and physiological parameters in sperm, such as acrosome status and chromatin structure, have never been compared. This study thus compared T1DM and T2DM mice with regard to sperm quality and the histopathology of the testis, epididymis, and penis.
Methods
This experiment was approved by the Animal Ethics Committee of Khon Kaen University based on the Ethics of Animal Experimentation as determined by the National Research Council of Thailand (No. 0514.1.75/90 with record No. AEKKU-NELAC 71/2559).
1. Animals and induction of diabetes
Fifty-six male C57BL/6 mice were purchased from Nomura Siam International Co., Ltd., Bangkok, Thailand. All mice were housed within ventilated cages in a specific pathogen-free room at a constant temperature (23°±2°C) under a 12-hour light-dark cycle at the Northeast Laboratory Animal Center of Khon Kaen University in Khon Kaen, Thailand. The animals were divided into four groups: (1) control for T1DM, (2) T1DM (multiple low doses of STZ [MLD-STZ]), (3) control for T2DM, and (4) T2DM (HFD cotreated with STZ [HFD-STZ]), with 14 for each group. Before the experiment, the mice were starved for 16 hours. The control mice for the T1DM group were intraperitoneally injected with 0.1 M citrate buffer (pH 4.5) for 5 consecutive days, whereas the T1DM mice were induced with STZ (Sigma-Aldrich, St. Louis, MO, USA) at a dose of 40 mg/kg body weight (BW) for 5 consecutive days [19]. The control mice of the T2DM group received a normal diet (10 kcal% fat, D12450J; Research Diets, New Brunswick, NJ, USA) for 14 consecutive days before they were starved and then injected with citrate buffer. The T2DM mice received an HFD (60 kcal% fat, D12492, Research Diet) for 14 consecutive days and were then induced with a single dose of STZ of 85 mg/kg BW [20,21] followed by continuous feeding with an HFD as previously described [26-28]. On days 3, 6, 12, 18, 24, 30, 36, 42, 48, 54, 60, 66, and 72, the mice in both DM groups were assessed for actual DM induction using a blood glucose oxidase reaction monitoring system with blood from a tail prick. Mice were considered to have DM when their blood glucose levels were greater than 250 mg/dL. All animals were treated for 36 or 72 days (one or two spermatogenesis cycles, [29]).
2. Morphological studies
After euthanasia, the testes, epididymis plus vas deferens, seminal vesicle plus prostate glands, and penis were collected. The fat pads surrounding these organs were removed before weighing. The gross morphology of the organs was observed and captured using a digital camera. The penis, right testis, and epididymis were fixed with Bouin solution for 48 hours before routine paraffin embedding. The paraffinized tissue blocks were sectioned at 5–7 μm (ERM 3100 Semi-Automatic Microtome, Heston, Australia). All sections were stained with hematoxylin and eosin (H&E) or Masson trichrome (No. HT15, Sigma-Aldrich) to observe and quantify the histopathological changes and collagen fibers. The diameters and epithelial heights of the seminiferous tubules, thickness of the tunica albuginea, cross-sectional area, and amount of collagen fibers of the penis were measured and quantified using the ImageJ program (ver. 1.50i; National Institutes of Health, Bethesda, MD, USA). The histopathology of the seminiferous tubules was classified as previously described [23]. In the epididymides, the density of sperm masses and abnormal cells on sections of the caput, corpus, and caudal parts was observed.
3. Sperm concentration and assessment of sperm head and tail abnormality
Sperm fluid was collected from the left caudal epididymis and vas deferens and resuspended into 1 mL of phosphate-buffered saline (PBS; 37°C, pH 7.4). The sperm suspension was subsequently centrifuged at 8,000×g for 5 minutes at 25°C. Then, the sperm pellets were collected and resuspended in fresh PBS to be diluted (1:10) before counting the number of sperm using a Neubauer hemocytometer under light microscopy. To examine sperm head and tail abnormalities, the sperm suspension (20 μL) was smeared on a glass slide in triplicate and air-dried. The dried sperm were then fixed with methyl alcohol and stained with H&E. Six hundred spermatozoa were examined for the presence of abnormal heads and tails, as described in the study conducted by Ward [30]. Types of abnormal sperm heads included thin-elongated head (H1), club-shaped head (H2), and mild head defects (H3). The classification of tail abnormalities included tail-bent head (T1), looping midpiece (T2), folded midpiece and principal piece (T3), and incorrect head-neck connection (T4), respectively. The numbers of abnormal sperm heads and tails were calculated as percentages.
4. Analysis of sperm acrosome reaction
The sperm pellets were fixed with 4% paraformaldehyde (w/v) in PBS (pH 7.4) for 15 minutes on ice. The samples were then washed and resuspended with PBS. The fixed sperm were smeared on gelatin-coated slides (Unifrost Microscope Slide, Catalogue No. EMS200Wþ; Azer Scientific, Morgantown, PA, USA) using a wooden stick. The dried sperm were stained with 0.22% Coomassie blue G-250 (50% methanol, 10% glacial acetic, 40% water) for 2 minutes and were then washed three times with PBS before mounting with a glycerol solution (Sigma-Aldrich). Six hundred sperm from each animal were examined under a light microscope. Acrosome-intact sperm were identified by staining of their acrosomes with Coomassie blue, whereas acrosome-reacted (AR) sperm did not show staining [31,32].
5. Evaluation of incomplete sperm DNA structure and packaging
Toluidine blue (TB) is a metachromatic dye commonly used to evaluate sperm nuclear chromatin condensation and DNA fragmentation via binding of the phosphate groups of DNA strands [33]. Smeared sperm were fixed with 96% ethanol-acetone (1:1) at 4°C for 30 minutes and then hydrolyzed in 0.1 N hydrochloric acid at 4°C for 5 minutes. The slides were rinsed twice in distilled water for 2 minutes and stained with 0.05% TB in 50% McIlvaine citrate-phosphate buffer (pH 3.5) for 10 minutes at room temperature. On each slide, 200 sperm were observed by counting the metachromatic sperm heads under light microscopy (ECLIPSE E200; Nikon, Tokyo, Japan). The unstained or pale TB-stained (negative) sperm were judged as normal-chromatin sperm, while sperm displaying intense TB staining (positive) were classified as abnormal-chromatin sperm [34].
6. Assessment of visualization of sperm chromatin condensation
Aniline blue (AB) selectively binds to lysine-rich histones and is used for staining to demonstrate abnormalities of sperm chromatin condensation [35]. Smeared sperm was air-dried and fixed in 2.5% glutaraldehyde buffer for 30 minutes at room temperature. Each smear was stained with 5% aqueous AB solution in 4% acetic acid (pH 3.5) for 5 minutes. Two hundred sperm were counted under light microscopy. Unstained or pale AB-stained (negative) sperm were considered to be sperm that had undergone normal chromatin condensation, while sperm displaying intense AB staining (positive) were classified as sperm with abnormal chromatin [18,34].
7. Statistical analysis
To compare the differences among groups, all data were first subjected to the Shapiro-Wilk test (W-test) to confirm a normal distribution and equality of variance. One-way analysis of variance was used to compare mean values for normally-distributed data using IBM SPSS ver. 19.0 (IBM Corp., Armonk, NY, USA). The p-values less than 0.05 were considered to indicate statistical significance. All data were expressed as the mean±standard deviation.
Results
1. Reproductive organ weight
The reproductive organs in both DM groups (at both 36 and 72 experimental days) were clearly smaller than those of the controls (Figure 1). The weight of the testes was also significantly lower in the DM mice (p<0.05) (Table 1), as was that of the epididymides plus vasa deferentia in the T1DM group at 36 days and in both DM groups at 72 days (p<0.05). At 72 days, the weights of these organs were significantly lower in the T1DM group than in the T2DM group (p<0.05) (Table 1). The weight of the seminal vesicles plus prostate glands in the DM groups was also significantly lower than in the control groups (p<0.05) (Table 1), but did not differ significantly between DM groups.
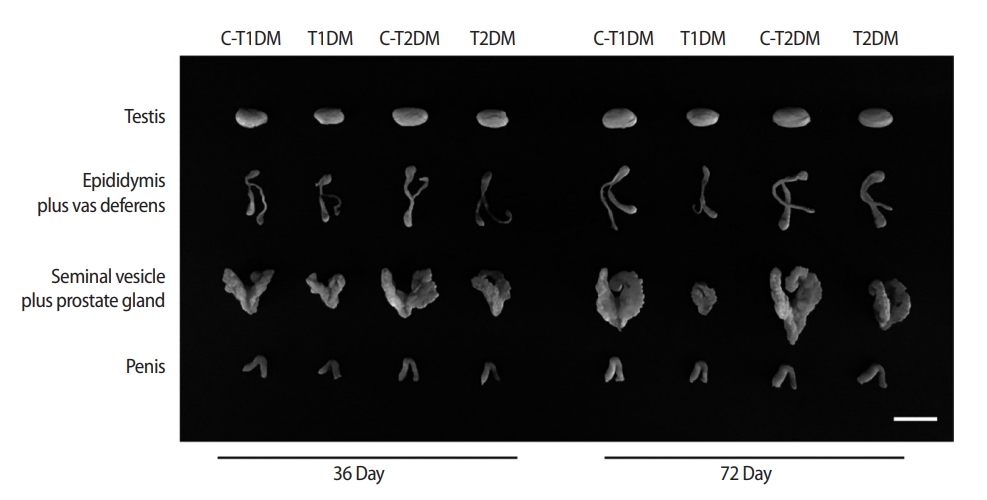
Representative morphological photographs of the mouse testis, epididymis plus vas deferens, seminal vesicle plus prostate gland, and penis compared among type 1 diabetes mellitus control (C-T1DM), type 1 DM (T1DM), type 2 DM control (C-T2DM), and type 2 DM (T2DM) mice on experimental days 36 and 72. Scale bar, 1 cm.

Comparison of male reproductive organ weight among C-T1DM, T1DM, C-T2DM, and T2DM mice
2. Blood glucose levels
Blood glucose levels in both DM groups were significantly higher than in the controls at both 36 and 72 days (p<0.05) (Tables 2 and 3).

Blood glucose levels at experimental day 36 compared among C-T1DM, T1DM, C-T2DM, and T2DM mice
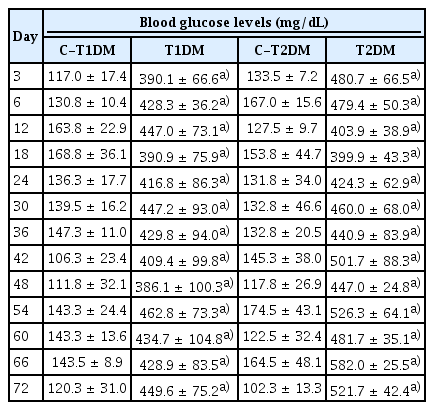
Blood glucose levels at experimental day 72 compared among C-T1DM, T1DM, C-T2DM, and T2DM mice
3. Sperm parameter analysis
The sperm concentrations in both DM groups were significantly lower than those of controls at both 36 and 72 experimental days (p<0.05) (Figure 2A). In addition, the percentages of AR sperm and incomplete DNA packaging in both DM groups were significantly higher than those of the controls (p<0.05) (Figures 2B and C). There was a statistically significant difference in chromatin condensation among the four groups, as shown by AB staining (Figure 2D). Sperm concentrations in the T1DM group were significantly lower than in the T2DM group, but the percentage of AR sperm was higher in the T1DM group (p<0.05) (Figures 2A and B).

Comparisons among type 1 diabetes mellitus control (C-T1DM), type 1 DM (T1DM), type 2 DM control (C-T2DM), and type 2 DM (T2DM) mice on experimental days 36 and 72. (A) Sperm concentration. (B) Acrosome reaction. Top right: representative photographs of acrosome-intact (AI) sperm stained with 0.22% Coomassie blue G-250 and acrosome-reacted (AR) sperm without staining. (C) Incomplete sperm DNA structure and packaging. Top right: toluidine blue-reacted (TB+) sperm indicating sperm with abnormal chromatin versus sperm with normal chromatin (TB–). (D) Visualization of sperm chromatin condensation. Top right: aniline blue-reacted (AB+) sperm indicating chromatin defects of sperm nuclei versus normal sperm (AB–). Values are presented as mean ± standard deviation. Scale bar, 1 μm. a)p< 0.05 compared with control; b)p< 0.05 compared with T2DM; c)p< 0.05 compared with T1DM.
A significant increase in total sperm abnormalities was observed in the DM groups (p<0.05) (Figure 3). As shown in Figure 4A, the percentage of sperm head abnormalities (H1 or H2) at 36 and 72 days was significantly higher in both DM groups than in the controls (with the exception of H2 in the T1DM group at 36 days). The percentage of tail abnormalities (T1, T2, and T3) was also higher in both groups (except T1 and T3 in the T2DM group at 36 days and 72 days, respectively) (Figure 4B). However, no significant difference was found in the percentage of T4 abnormalities among groups (Figure 4B).
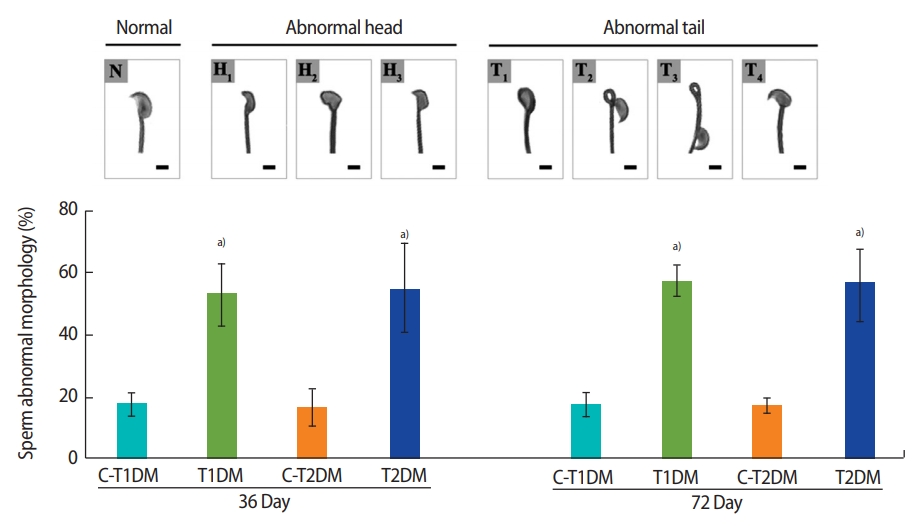
The percentage of total abnormal sperm morphology compared among type 1 diabetes mellitus control (C-T1DM), type 1 DM (T1DM), type 2 DM control (C-T2DM), and type 2 DM (T2DM) mice on experimental days 36 and 72. Values are presented as mean ± standard deviation. Scale bar, 1 μm. N, normal; H1, thin-elongated head; H2, club-shaped head; H3, mild head defects; T1, bent head; T2, looping midpiece; T3, folded midpiece and principal piece; T4, incorrect head-neck connection. a)p< 0.05 compared with controls.
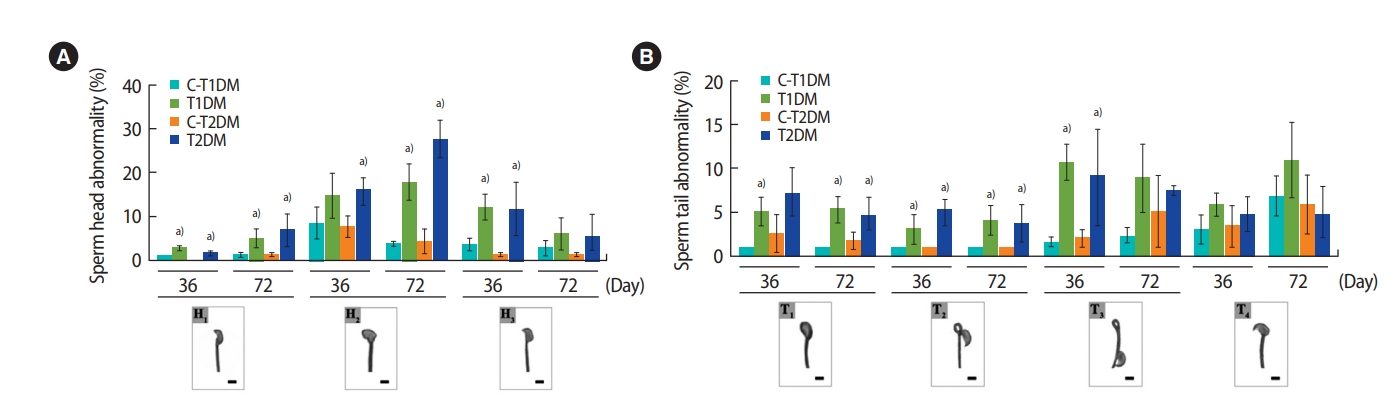
The percentages of individual types of abnormal sperm morphology compared among type 1 diabetes mellitus control (C-T1DM), type 1 DM (T1DM), type 2 DM control (C-T2DM), and type 2 DM (T2DM) mice on experimental days 36 and 72. (A) Abnormalities of the head. (B) Abnormalities of the tail. Values are presented as mean ± standard deviation. Scale bar, 1 μm. H1, thin-elongated head; H2, club-shaped head; H3, mild head defects; T1, bent head; T2, looping midpiece; T3, folded midpiece and principal piece; T4, incorrect head-neck connection. a)p< 0.05 compared with controls.
4. Testicular histopathology
The percentage of total seminiferous histopathology in the DM groups was significantly higher than in the control groups (p<0.05) (Figure 5) but did not differ significantly between the DM groups. Seminiferous histopathology was classified into seven types and compared among groups (Figure 6A). As shown in Figure 6Aa, the seminiferous epithelium was well-organized in all groups. By contrast, the DM groups displayed a significantly greater amount of sloughing of deciduous spermatogenic cells into the lumen compared to the controls (Figure 6Bb). The number of seminiferous epithelial cells with large nuclei was also significantly higher in the DM groups than in the controls and in the T1DM group than in the T2DM group on both days 36 and 72 (Figure 6Bc). The DM groups also displayed a significantly higher number of small-nucleus cells with vacuolization (Figure 6Bd), fewer layers of spermatogenic cells, and greater sloughing of germ cell elements into the seminiferous lumen (Figure 6Be) than the controls. There were greater numbers of cells of both histopathological types in the MLD-STZ group than in the HFDSTZ group at 36 days, but there were conversions between the 2 types within 72 days (Figure 6Bd and e). The T2DM group also displayed more vacuolization in Sertoli cells without spermatids than the controls (Figure 6Bf). Moreover, atrophic tubular cells with germ cell degeneration and vacuolization were observed (Figure 6Ag). Reduction of the germinal epithelium (Figure 6Bh) was also significantly more prevalent in the T2DM group than in the controls. All the histopathological findings observed in the T2DM group were significantly more pronounced than in the T1DM group (p<0.05) (Figure 6Bg and h).
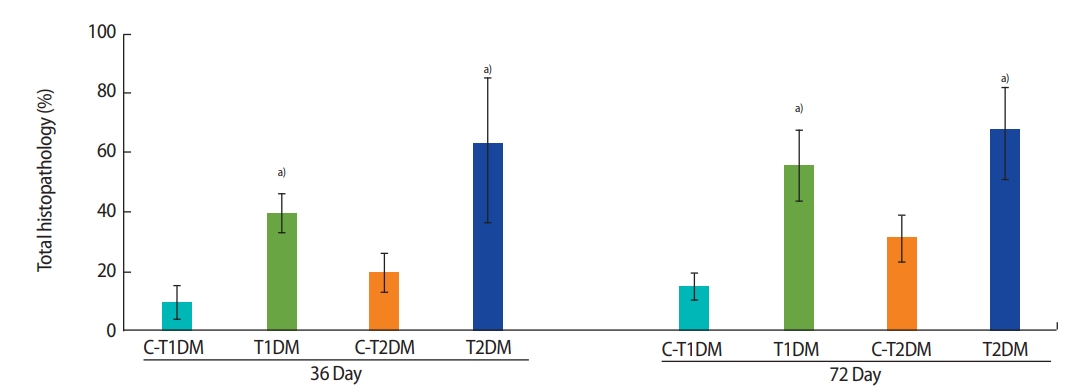
Seminiferous histopathology of the testis (%) compared among type 1 diabetes mellitus control (C-T1DM), type 1 DM (T1DM), type 2 DM control (C-T2DM), and type 2 DM (T2DM) mice on experimental days 36 and 72. Values are presented as mean ± standard deviation. a)p< 0.05 compared with controls.
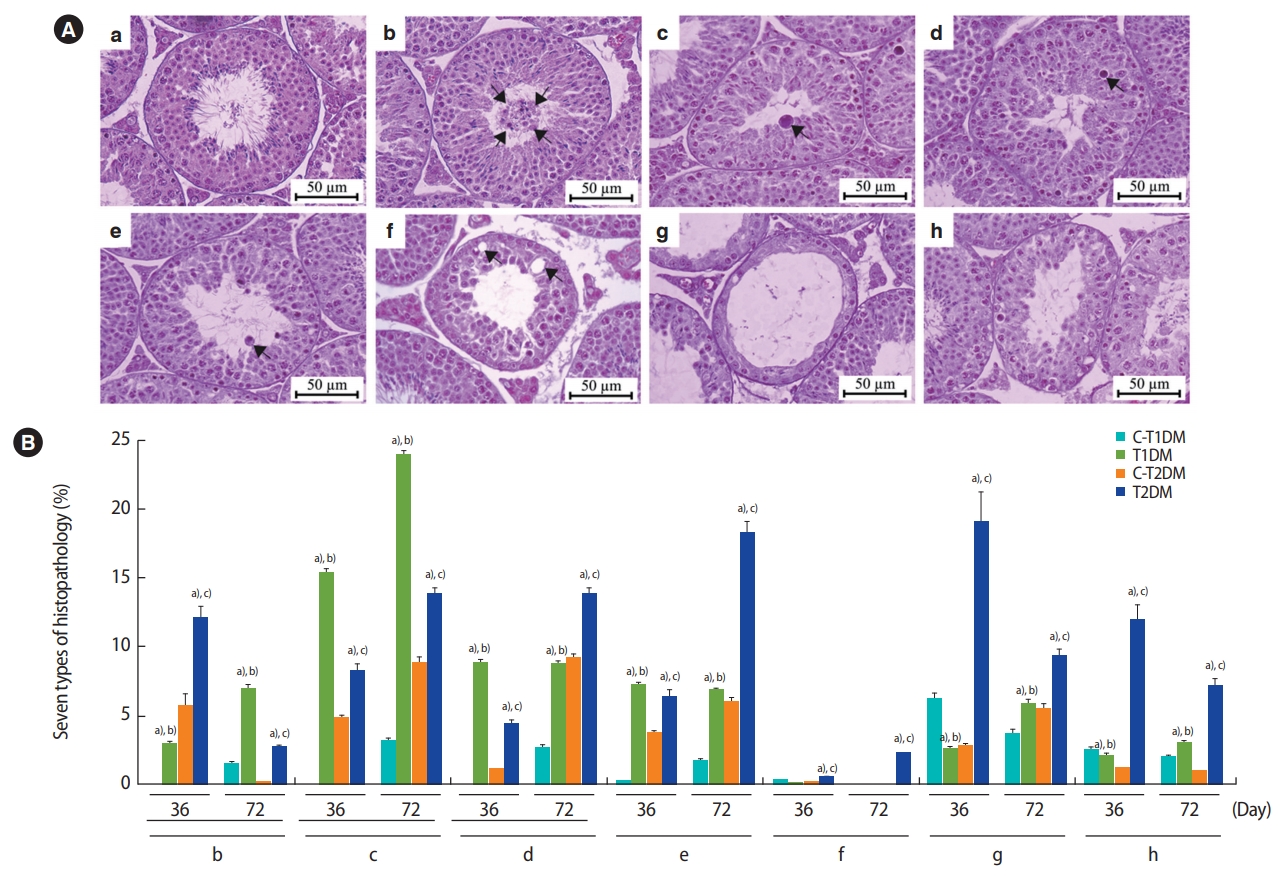
(A) Representative photomicrographs showing normal histology and histopathology. (a) Control group; normal arrangement of spermatogenic and Sertoli cells. (b-h) Histopathological findings of the seminiferous tubules found in the type 1 and type 2 diabetes mellitus (T1DM and T2DM) groups. (b) Sloughing of deciduous and spermatogenic cells (arrows) into the tubular lumen. (c) Cell with large nuclei (arrow) in the seminiferous epithelium. (d) Cell with small nuclei and vacuolization (arrow) in the seminiferous epithelium. (e) Few spermatogenic cell layers of artifactual sloughing (arrow) of germ cell elements into the lumen. (f) Vacuolization (arrows) of Sertoli cells and absence of spermatids. (g) Atrophy with germ cell degeneration and small vacuolization between spermatogonia and Sertoli cells. (h) Hypospermatogenesis with all germ layers diminished. (B) Seven histopathology types by percentage. Values are presented as mean ± standard deviation. C-T1DM, type 1 diabetes mellitus control; C-T2DM, type 2 DM control. a)p< 0.05 compared with controls; b)p< 0.05 compared with T2DM; c)p< 0.05 compared with T1DM.
5. Histology of the epididymis
The lumens of the caput, corpus, and caudal epididymides contained a greater percentage of round cells in both DM groups than in the control groups (Figure 7). The numbers of round germ cells at 72 days were higher than at 36 days (Figure 7). The density of sperm mass in the epididymal lumen of the T1DM and T2DM groups were lower than those controls (Figure 7), which corroborated with the significant decrease in sperm concentration shown in Figure 2A.
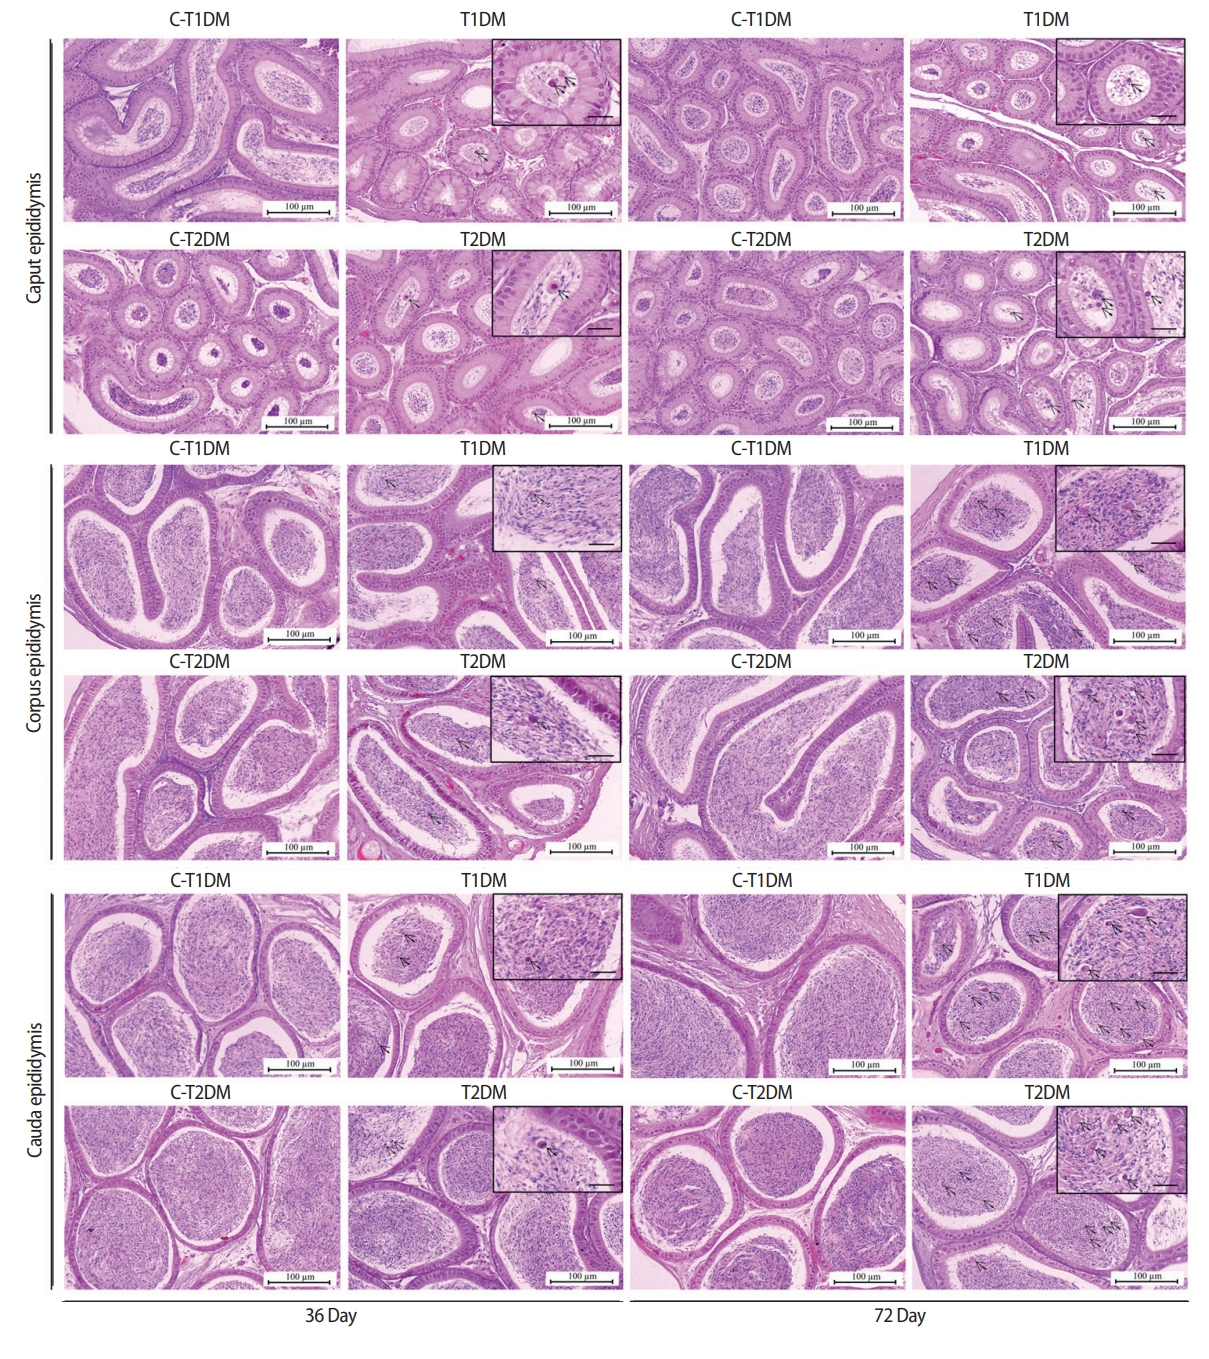
Representative histology of caput, corpus, and caudal epididymides of type 1 diabetes mellitus control (C-T1DM), type 1 DM (T1DM), type 2 DM control (C-T2DM), and type 2 DM (T2DM) mice on experimental days 36 and 72. Arrows indicate the round germ cells in the epididymal lumen (small panels; scale bar, 20 μm).
6. Histomorphometry of seminiferous tubules
The diameter and epithelial height of seminiferous tubules were significantly lower in the DM groups than in the controls (p<0.05) (Figure 8). Furthermore, the thickness of the tunica albuginea was significantly greater at day 36 and had increased to a greater extent at day 72 in the DM groups than in the controls (p<0.05) (Figure 9).
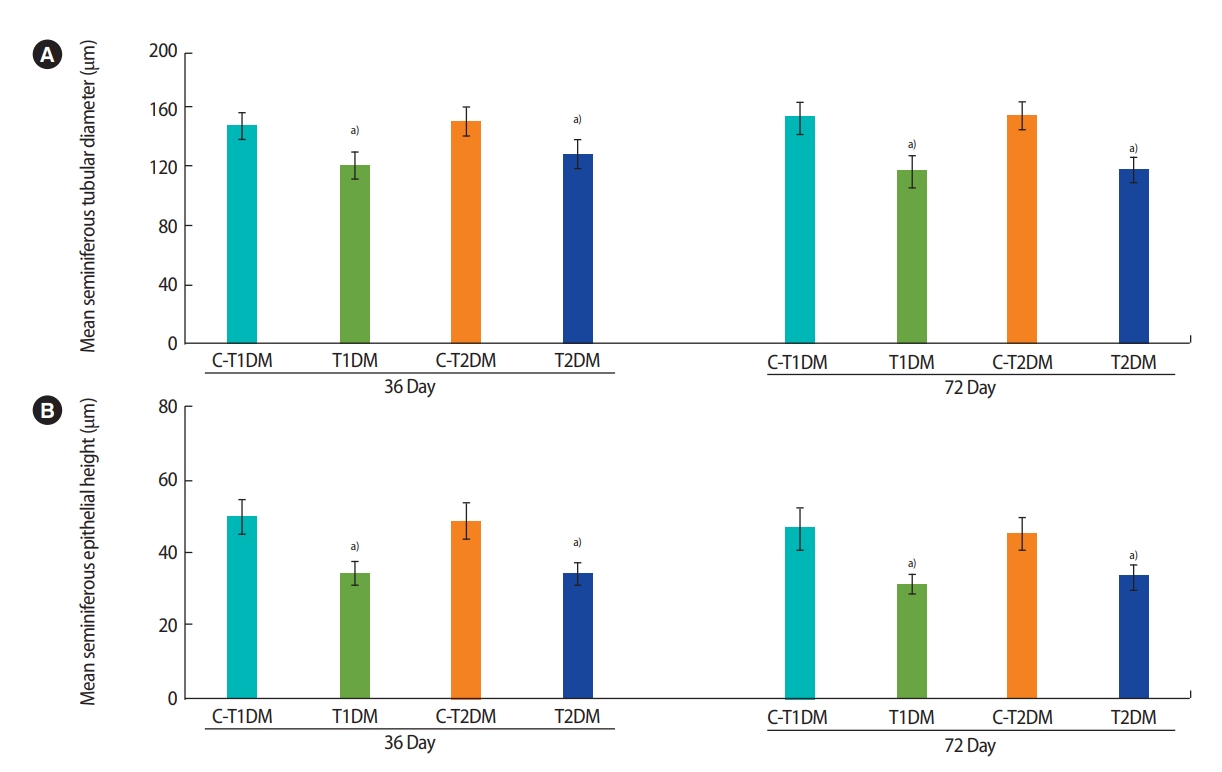
Histomorphometric analysis of seminiferous tubular diameter (A) and epithelial height (B) compared among type 1 diabetes mellitus control (C-T1DM), type 1 DM (T1DM), type 2 DM control (C-T2DM), and type 2 DM (T2DM) mice on experimental days 36 and 72. Values are presented as mean ± standard deviation. a)p< 0.05 compared with controls.
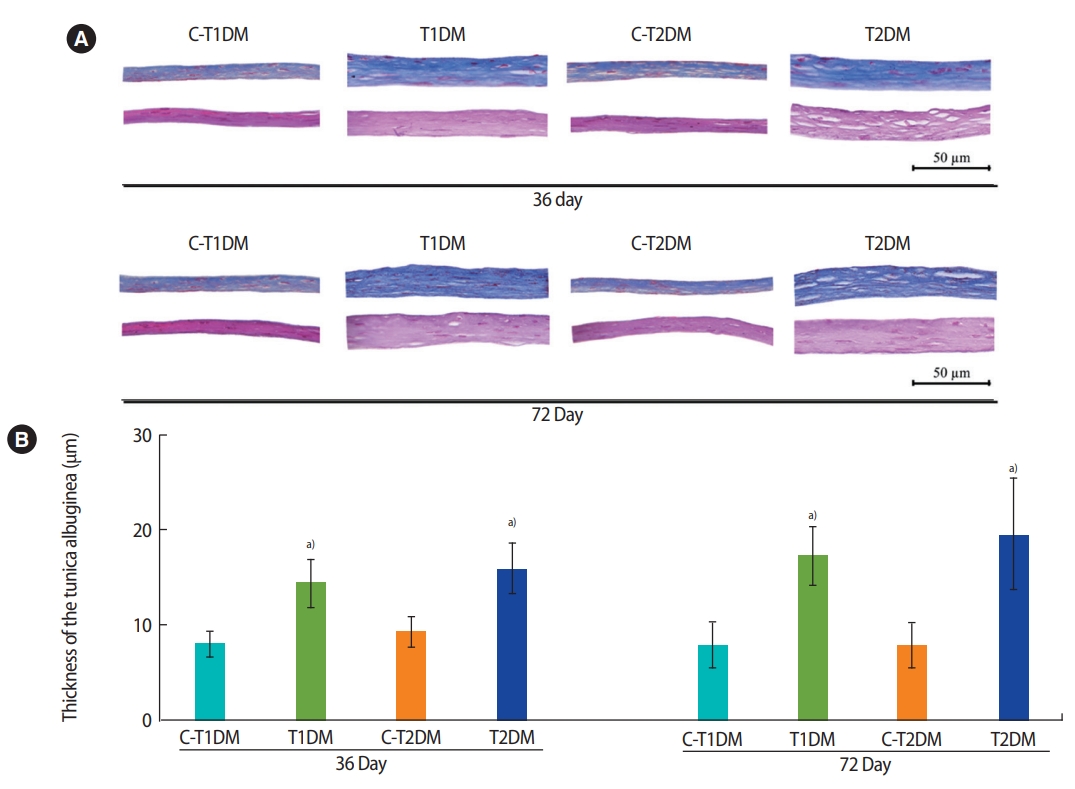
Representative histology of tunica albuginea stained by H&E (lower panels) and Masson’s trichrome (upper panels; A) and thickness (B) compared among type 1 diabetes mellitus control (C-T1DM), type 1 DM (T1DM), type 2 DM control (C-T2DM), and type 2 DM (T2DM) mice on experimental days 36 and 72. Values are presented as mean ± standard deviation. a)p< 0.05 compared with controls.
7. Penile histomorphometry
The percentage of the penile cross-sectional area in the T1DM and T2DM groups was significantly lower at 36 days and were slightly lower at 72 days compared to the controls (p<0.05) (Figure 10). As shown in Figure 11A, the amount of collagen fibers of the penis was greater in both DM groups than in the controls. Similarly, the percentage of penile collagen fibers was significantly higher in the DM groups than in the controls (p<0.05) (Figure 11B).
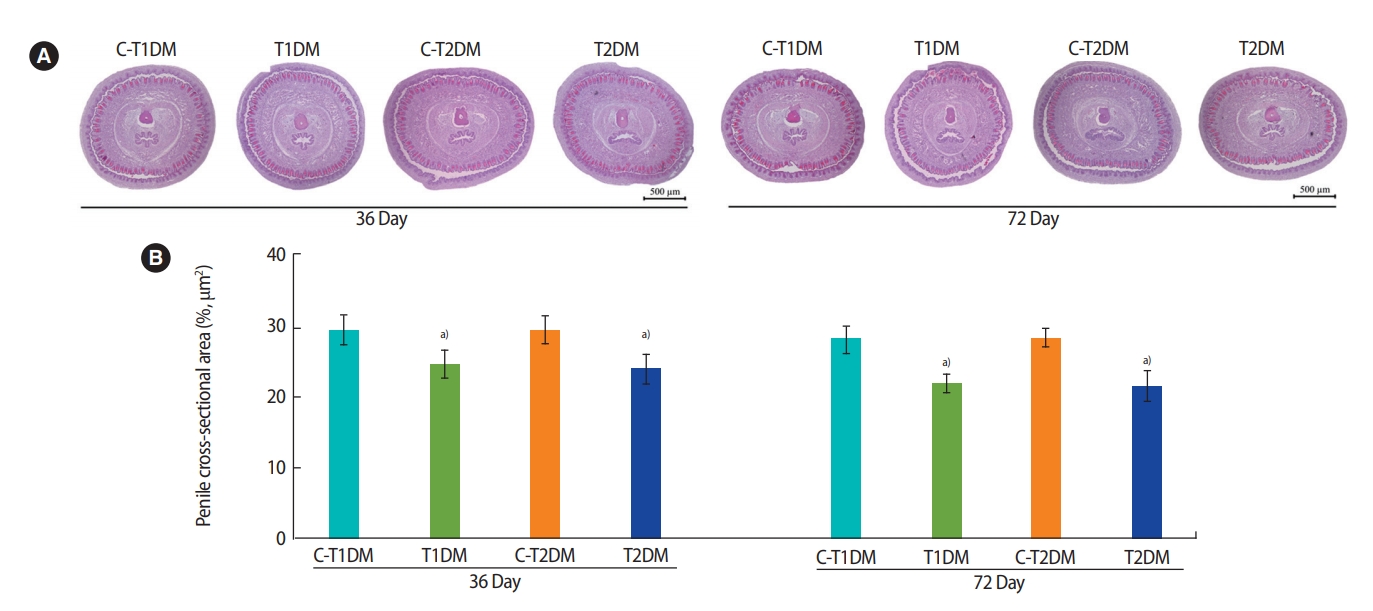
(A) Representative penile histology as shown by H&E staining and (B) percentage of the penile cross-sectional area compared among type 1 diabetes mellitus control (C-T1DM), type 1 DM (T1DM), type 2 DM control (C-T2DM), and type 2 DM (T2DM) mice on experimental days 36 and 72. Values are presented as mean ± standard deviation. a)p< 0.05 compared with controls.
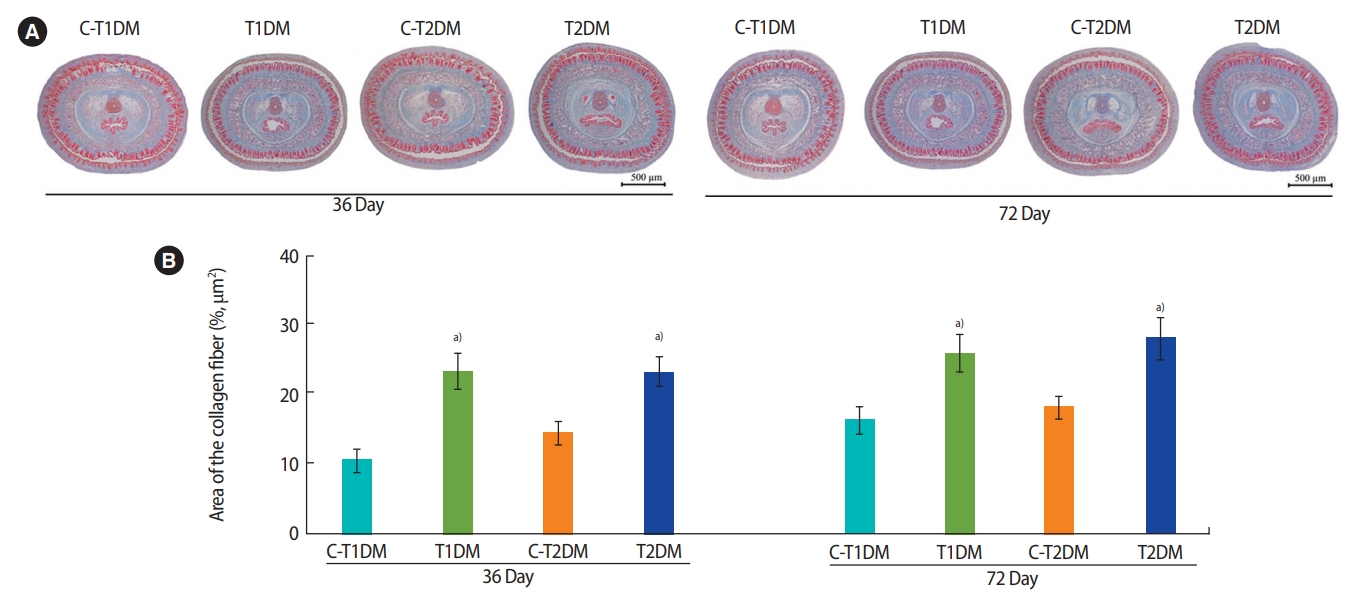
(A) Penile collagen fibers stained using Masson trichrome and (B) percentage of collagen fiber area compared among type 1 DM control (C-T1DM), type 1 DM (T1DM), type 2 DM control (C-T2DM), and type 2 DM (T2DM) mice on experimental days 36 and 72. Values are presented as mean ± standard deviation. a)p< 0.05 compared with controls.
Discussion
Recent studies have found decreases in the weights of male reproductive organs of animals with DM [5,36-38]. Chronic DM may induce oxidative stress, leading to damage to male reproductive structures and functions [39-41]. Although the seminiferous histopathology of T1DM mice has been described elsewhere [23], this study is the first to compare these histopathological parameters by DM type. In T1DM mice, the prevalence of histopathology by type at 36 days was e>c>d>b>g>h, and the prevalence was types c>b>e>d>g>h at 72 days. In T2DM mice, the prevalence was types h>g>d>f>b>c=e at 36 days, and it was types b>h>e>f>g>c>d at 72 days. The decreases in diameter and epithelial height of the seminiferous tubules of T1DM and T2DM mice in our study were similar to those found in previous reports [23,38,42-44]. Our study also found a positive correlation between seminiferous tubule diameter and spermatogenesis along with decreased sperm concentration in the T1DM and T2DM mice. The abundance of round cells found in the epididymal lumens of DM mice was also consistent with previous reports [23,45] and may result from germ cell loss from the seminiferous epithelium [46,47]. The increase of collagen fibers in the tunica albuginea of the penis in T1DM and T2DM mice found in this study was also similar to previous studies [48,49]. Consistent with a previous report [50], the penile cross-sectional area (%) was decreased in DM mice, resulting in atrophy of the penis. The increase of collagen fibers in the testis of animals with DM may have been caused by increased expression of transforming growth factor beta 1 and nitric oxide synthase [51-54].
Similar to our study, previous studies have demonstrated decreases of sperm concentration in DM human and animal models [5,6,37,42,55-58], which may be due to impaired spermatogenesis [5,6,12,57,59-61]. The increase of total abnormal sperm morphology in both groups of DM mice in our study was consistent with the findings of previous studies [23,37,42,62-65]. It is possible that DM affects the regulation of some proteins involved in the formation of sperm structures, such as hook microtubule tethering protein 1 (Hook1) and disintegrin and metalloprotease 7 (ADAM7) [60,66-68]. Additionally, DM-induced oxidative stress may cause nondisjunction, mitochondrial DNA damage, and defective centriole migration in germ cells [64,69]. Increased amounts of AR sperm have been found in animals exposed to various induction methods, including HFD, drugs, or stressors [23,31,32,70-72]. The significant decrease of testicular nerve growth factor levels in DM animals [73,74] implies that the impairment of AR formation by DM affects regulation via the testicular nerve growth factor signaling pathway [74,75]. Several studies have shown increases of sperm with fragmented nuclear DNA in men with DM [10,76,77]. In the present study, the increase in sperm with damaged DNA in mice with DM was greater than in previous studies [34,78]. It is possible that chromatin decondensation and sperm DNA fragmentation are more sensitive in animal DM models [10,34,71]. However, there was no significant difference in the percentage of AB-positive sperm cells in our study, similarly to previous reports [34,78]. Although DM may not affect chromatin packaging, it is correlated with sperm morphology [34,79].
This study reported that T1DM and T2DM mice were similar in terms of nearly all adverse reproductive parameters, but that the severity of the reduction in sperm concentration and precocious acrosome exocytosis was greater in those with T1DM.
Notes
Conflict of interest
No potential conflict of interest relevant to this article was reported.
Author contributions
Conceptualization: AS and SI. Data curation: SA and AS. Formal analysis: WS and AS. Funding acquisition: SI. Methodology: AS, JB, SA, and WS. Project administration: SI. Visualization: AS and SI. Writing - original draft: AS. Writing - review & editing: SI.
Acknowledgements
Financial support for this research was provided by an Invitation Research Grant (IN60205), Faculty of Medicine, Khon Kaen University, awarded to Dr. Apichakan Sampannang and associate professor Dr. Sitthichai Iamsaard, which was granted by the Performance & Health Promotion (HHP&HP) Research Institute of Khon Kaen University.