Relationship between reactive oxygen species and autophagy in dormant mouse blastocysts during delayed implantation
Article information
Abstract
Objective
Under estrogen deficiency, blastocysts cannot initiate implantation and enter dormancy. Dormant blastocysts live longer in utero than normal blastocysts, and autophagy has been suggested as a mechanism underlying the sustained survival of dormant blastocysts during delayed implantation. Autophagy is a cellular degradation pathway and a central component of the integrated stress response. Reactive oxygen species (ROS) are produced within cells during normal metabolism, but their levels increase dramatically under stressful conditions. We investigated whether heightened autophagy in dormant blastocysts is associated with the increased oxidative stress under the unfavorable condition of delayed implantation.
Methods
To visualize ROS production, day 8 (short-term dormancy) and day 20 (long-term dormancy) dormant blastocysts were loaded with 1-µM 5-(and-6)-chloromethyl-2', 7'-dichlorodihydrofluorescein diacetate, acetyl ester (CM-H2DCFDA). To block autophagic activation, 3-methyladenine (3-MA) and wortmannin were used in vivo and in vitro, respectively.
Results
We observed that ROS production was not significantly affected by the status of dormancy; in other words, both dormant and activated blastocysts showed high levels of ROS. However, ROS production was higher in the dormant blastocysts of the long-term dormancy group than in those of the short-term group. The addition of wortmannin to dormant blastocysts in vitro and 3-MA injection in vivo significantly increased ROS production in the short-term dormant blastocysts. In the long-term dormant blastocysts, ROS levels were not significantly affected by the treatment of the autophagy inhibitor.
Conclusion
During delayed implantation, heightened autophagy in dormant blastocysts may be operative as a potential mechanism to reduce oxidative stress. Further, ROS may be one of the potential causes of compromised developmental competence of long-term dormant blastocysts after implantation.
Introduction
Delayed implantation, often dubbed embryonic diapause, is a reproductive strategy that responds to unfavorable conditions for implantation, such as climate, day length, availability of nutrients, and psychosocial conditions [1,2,3,4,5]. Embryonic diapause is usually manifest in the blastocyst stage and is an obligate process of normal reproductive cycles of many mammals including marsupials and mustelids [1]. In rodents, however, embryonic diapause occurs only when there is a shortage of estrogen during implantation. For example, implantation is delayed in lactating mice due to the suppression of estrogen secretion by prolactin [6]. In addition, delayed implantation can be experimentally induced when ovariectomy is performed prior to implantation. In mice, blastocyst implantation requires well-coordinated secretion of ovarian steroid hormones, progesterone (P4) and estrogen, and these hormones establish the uterine receptivity for implantation [7]. The P4 level is highly maintained from day 3 of pregnancy onward. Estrogen secretion occurs during the morning of day 4 of pregnancy and is a very small amount [8]. When this estrogen secretion is blocked by ovariectomy, blastocysts cannot initiate the process of implantation and enter dormancy. This is due to various changes in the molecular and cellular aspects of both the uterus and the embryo [9,10]. Dormant blastocysts can survive in utero for weeks, and their overall metabolic rates are lower than those of normal blastocysts. For example, both DNA and protein synthesis rates decrease, and the embryos exhibit metabolic quiescence [11,12].
Autophagy is a catabolic process that targets long-lived proteins and organelles to lysosomes for degrading and recycling [13,14]. Autophagy affects cellular homeostasis by the degradation of misfolded proteins, other macromolecules, and other components of cytoplasm including organelles. Many inducers of autophagy, such as deprivation of nutrients, hypoxia, oxidative stress, and various suboptimal conditions, have been identified [15]. We previously showed that dormant blastocysts exhibit heightened autophagy during delayed implantation and that autophagy may be sustained to maintain the low-energy status of dormant blastocysts during prolonged survival in utero [16]. Inhibition of autophagy by the administration of 3-methyladenine (3-MA) to delayed implanting mice reduces the number of surviving dormant blastocysts [16].
Reactive oxygen species (ROS), including superoxide anions (O2-), hydrogen peroxide (H2O2), and hydroxyl radicals (HO-), are highly reactive molecules causing oxidative stress within cells [17]. The basal physiological levels of ROS act as intracellular signaling molecules that mediate cellular responses to nutrient deprivation, hypoxia, and others [18]. Recent data show that ROS regulates both death-related autophagy and starvation-induced autophagy for cell survival [19,20,21]. It has been shown that autophagy-defective cells accumulate damaged mitochondria and exhibit increased production of ROS [22,23], suggesting that autophagy serves to reduce the damage done by excessive ROS production [20,24].
During delayed implantation, dormant embryos maintain a free-floating state in the uterus and are exposed to the hypoxic condition of the uterus longer than normal embryos [25,26,27]. As autophagy is important for the extended longevity of dormant blastocysts for their prolonged survival [16], we sought to investigate whether autophagy plays a role in regulating the oxidative stress of dormant blastocysts. Using the inhibitors of autophagosome formation, we show that autophagy is associated with the regulation of ROS production during delayed implantation in mice.
Methods
1. Ethics statement
Mice were maintained in accordance with the policies of the Konkuk University Institutional Animal Care and Use Committee (IACUC). The study conducted herein was approved by the Konkuk University IACUC (approval number: KU14005).
2. Reagents and dyes
P4 (P0130) and 17β-estradiol (E2, E8875) were purchased from Sigma-Aldrich (St. Louis, MO, USA). Sesame oil (241002500) was purchased from Acros Organics (Leicestershire, UK). Three-methyladenine (3-MA) (M9281) and wortmannin (W1628) were purchased from Sigma-Aldrich. LysoTracker Red DND-99 (L7528), MitoTracker Red CMXRos (M7512), and non-fluorescent compound 5-(and-6)-chloromethyl-2', 7'-dichlorodihydrofluorescein diacetate, acetyl ester (CM-H2DCFDA) (C6827) were purchased from Invitrogen (Carlsbad, CA, USA). H2O2 was purchased from Sigma-Aldrich.
3. Delayed implantation and collection of dormant and activated blastocysts
Five-week-old virgin ICR female mice were purchased from Orient-Bio (Seongnam, Korea). At week 6, female mice were bred with stud male mice. The presence of the vaginal plug was checked the following morning, and this day was designated as day 1 of pregnancy. To induce delayed implantation, pregnant mice were ovariectomized (OVX) at 8:00 AM on day 4 of pregnancy and received a daily injection of progesterone (P4, 2 mg/0.1 mL sesame oil, subcutaneous injection) from day 5 to the day before sacrifice (Figure 1A) [16]. Dormant blastocysts were collected from these mice on day 8, day 15, and day 20 of pregnancy. To resume implantation, P4-primed delayed implanting mice were injected with estrogen (E2, 25 ng/0.1 mL sesame oil) in addition to P4. Activated blastocysts were obtained 12-13 hours after E2 injection (Figure 1B). To inhibit autophagy during delayed implantation, mice were OVX on day 4 of pregnancy and received a 3-MA (5 mM in PBS) or PBS (vehicle) injection daily (Figure 1C). Dormant or activated blastocysts were recovered by flushing the uteri with an M2 medium (Sigma-Aldrich).

Model of delayed implantation and experimental schemes used in this study. (A) Collection of dormant blastocysts during delayed implantation. (B) Collection of activated blastocysts after E2 injection. (C) 3-MA injection during delayed implantation and collection of dormant blastocysts. OVX, ovariectomized; P4, progesterone; E2, estrogen; 3-MA, 3-methyladenine.
4. Culture of embryos
All embryos were cultured in vitro in KSOM-AA (Millipore, Billerica, MA, USA). To block autophagy in dormant blastocysts, 100-nM wortmannin, a widely used inhibitor of autophagy, was added to the culture medium for 1 hour. After washing, embryos were incubated in the culture media containing CM-H2DCFDA for 30 minutes.
5. Visualization of reactive oxygen species by confocal live imaging
To visualize ROS in embryos, dormant and activated blastocysts were cultured in KSOM-AA media containing a 1-µM CM-H2DCFDA for 30 minutes in the dark. A cell-permeable fluorogenic probe, 2'-7'-dichlorodihydrofluorescein (DCF), is sensitive to oxidizing oxygen radicals [28]. LysoTracker Red (500 nM) or MitoTracker Red (1 µM) was used along with CM-H2DCFDA to stain lysosomes or mitochondria, respectively. As a positive control, some embryos were incubated in culture media containing 500 nM H2O2 for 10 minutes before ROS was visualized by CM-H2DCFDA. Embryos were washed 3 times with the KSOM-AA media to remove traces of the unincorporated dye. Embryos were then placed on a glass bottom plate (SPL Lifescience, Pocheon, Korea) and excited with 488-nm lasers for 3 minutes. Images were obtained using the Olympus Fluoview FV1000 confocal microscope equipped with multi Argon-ion (457, 488, and 515 nm), He-Ne (green, 543 nm), and He-Ne (red, 633 nm) lasers. Images were analyzed using the software Fluoview version 1.5 (Olympus) [16].
6. Statistical analysis
Fluorescence intensity was analyzed in the Fluoview software by setting one sectional plane of a whole blastocyst as the region of interest. The ROS level (green fluorescence) of each blastocyst was measured and plotted for relative intensity. The GraphPad Prism (version 5) software was used for all the analyses and graphing. Statistical significance was assessed using a Student's t-test, and p-values higher than 0.05 were considered significant.
Results
1. Visualization of ROS production in day 15 dormant and activated embryos
In our previous work, we showed that autophagy is highly activated in dormant blastocysts during delayed implantation [16]. We hypothesized that autophagic activation in dormant blastocysts may play a role in reducing ROS levels and the resultant damage. To visualize ROS production in dormant and activated blastocysts, we used CM-H2DCFDA [28,29]. We first assessed ROS production in day 15 dormant and activated blastocysts under a confocal microscope (Figure 2A). H2O2 was added to a group of dormant blastocysts as a positive control. As shown in Figure 2A, we observed scattered green puncta in both the inner cell mass and the trophectoderm of both dormant and activated blastocysts; these puncta mostly overlapped with lysosomes (LysoTracker-positive, red). Overall, the ROS levels were similar between dormant and activated blastocysts. Further, H2O2-treated dormant blastocysts, the positive control, showed heightened levels of ROS production.

Detection of ROS production by CM-H2DCFDA staining in embryos. (A) Dormant blastocysts were collected on day 15 of delayed implantation. To obtain activated blastocysts, 25 ng of E2 in addition to P4 was given on day 15, and uteri were flushed 12 hours later. H2O2 (500 µM) was used to induce ROS production in the positive control group; these embryos were stained with CM-H2DCFDA for 10 minutes. Three embryos were used in the experimental group, and experiments were repeated three times. White scale bar, 20 µm. (B) Day 4 normal, day 8 dormant, and day 20 dormant blastocysts were collected and subjected to ROS visualization by using CM-H2DCFDA. Embryos were counterstained with MitoTracker Red. Five-eight embryos were used in each experimental group, and the experiments were repeated three times. The statistical analysis is shown in Figure 4. White scale bar, 20 µm. P4, progesterone; E2, estrogen; H2O2, hydrogen peroxide; ROS, reactive oxygen species; Green, CM-H2DCFDA; red, MitoTracker red.
2. ROS production is increased in long-term dormancy group as compared to short-term dormancy group
We confirmed the production of ROS in day 15 dormant and activated blastocysts. To compare the ROS production in short-term and long-term dormant blastocysts, we chose two time points that were far apart: day 8 dormant blastocysts of the short-term dormancy group (dormancy period of 3.5 days) and day 20 dormant blastocysts of the long-term dormancy group (dormancy period of 15.5 days). These dormant blastocysts were subjected to CM-H2DCFDA staining (Figure 2B). A group of day 4 embryos received H2O2 treatment to enhance ROS production and were used as a positive control (Figure 2B, first two panels). As shown, day 20 dormant blastocysts consistently showed a higher level of ROS production than day 8 dormant blastocysts, suggesting that more ROS is produced during a prolonged period of dormancy (Figures 2B and 4A).
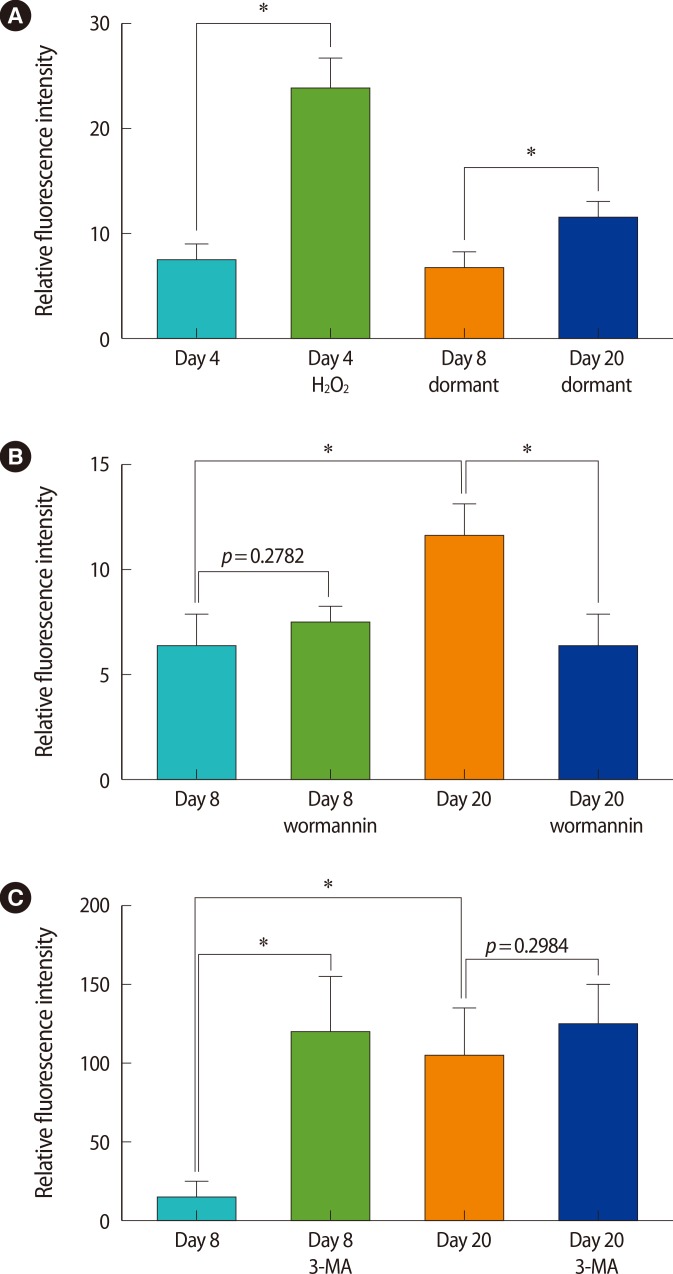
Statistical analyses of ROS levels. Blastocysts used in experiments of Figures 2 and 3 were analyzed using the Fluoview software. One sectional plane of the a whole blastocyst was set as the region of interest, and the fluorescence intensity was measured. Since the fluorescence varies in each experiment, blastocysts from one set of experiments (3-5 per group) were included in the analysis. A Student's t-test was performed, and p-values lower than 0.05 are marked with an asterisk (*). (A) Relative fluorescence intensity of data shown in Figure 2B. (B) Relative fluorescence intensity of data shown in Figure 3A. (C) Relative fluorescence intensity of data shown in Figure 3B. ROS, reactive oxygen species; H2O2, hydrogen peroxide; 3-MA, 3-methyladenine.
3. Effect of wortmannin on ROS production in dormant and activated blastocysts in vitro
The above result shows that more ROS production is noted in the long-term dormancy group than in the short-term dormancy group. To investigate the relationship of ROS production and autophagic activation, dormant blastocysts were cultured for 1 hour in KSOM-AA media containing 100-nM wortmannin, an inhibitor of autophagy that belongs to class III phosphatidylinositol 3 kinase (PI3K) inhibitors[30]. As shown in Figures 2 and 3, day 8 dormant blastocysts do not show much ROS production. However, when wortmannin was treated in vitro, ROS production increased slightly in these blastocysts (Figure 3A). This increase was not statistically significant (Figure 4B). ROS production was clearly visible in day 20 dormant blastocysts (Figure 3A), and a brief exposure of wortmannin reduced the ROS production in these blastocysts.

Effects of inhibition of autophagy on ROS production in short-term and long-term dormant blastocysts. (A) To block autophagy briefly in vitro, 100-nM wortmannin was added to the culture medium for 1 hour. DMSO was the vehicle. Six-eight embryos were used in the experimental group, and the experiments were repeated two times. The statistical analysis is shown in Figure 4. White scale bar, 20 µm. (B) To inhibit autophagy during delayed implantation, 5-mM 3-MA was given daily by intraperitoneal injection from day 4 to the day of sacrifice (see Figure 1C). Three embryos were used in the experimental group, and the experiments were repeated six times. The statistical analysis is shown in Figure 4. White scale bar, 20 µm. DMSO, dimethyl sulfoxide; ROS, reactive oxygen species; Green, CM-H2DCFDA; red, MitoTracker red; 3-MA, 3-methyladenine.
4. Effect of 3-MA injection to delayed implanting mice on ROS production in dormant blastocysts
The above experiment used a brief in vitro exposure of wortmannin to block autophagy and generated mixed results. To investigate whether long-term inhibition of autophagy in vivo affects the ROS production in dormant blastocysts differently, we gave the delayed implanting mice daily injections of 5-mM 3-MA from day 5 to the day of sacrifice (Figure 1C). The injection scheme and the concentration of 3-MA were the same as those in our previous in vivo experiment that showed a decreased survival rate of dormant blastocysts during delayed implantation [16]. As shown in Figure 3B, multiple injections of 3-MA clearly increased ROS production in day 8 dormant blastocysts (see Figure 4C for a statistical analysis). While day 20 dormant blastocysts also seemed to exhibit increased ROS production after the 3-MA treatment, this result varied among different sets of experiments.
Discussion
We previously established that autophagy is highly activated in dormant blastocysts, during their prolonged survival in the free-floating state in utero during delayed implantation [16]. While it was proposed that autophagy is a critical cellular program that is utilized for the survival of dormant blastocysts, the mechanism of operation has remained unknown. In this work, we establish that ROS is produced in dormant blastocysts and that inhibition of autophagy during delayed implantation is associated with a heightened level of ROS production. These results indicate that autophagic activation is a potential regulator of intracellular ROS production in dormant blastocysts.
Preimplantation embryos are exposed to a hypoxic environment in the female reproductive tract [25,26,27], and such oxidative stress acts as a secondary messenger by regulating transcription factors that are sensitive to the reduction-oxidation (redox) state. Such transcription factors, namely, hypoxia inducible factor-1 (HIF-1), nuclear factor κB, and redox effector factor-1, play critical roles in cellular metabolism, proliferation, and survival under normal circumstances [31,32]. However, excessive oxidative stress has an adverse effect on the subsequent embryo development [31]. Therefore, cellular mechanisms exist to moderate the ROS production within cells. To moderate ROS production under various circumstances, the redox system is incorporated as part of various signaling pathways including autophagy [17]. The oxidative stress caused by hypoxia activates HIF-1, and then, HIF-1 induces the production of Bcl2/adenovirus EIB 19 kD-interacting protein 3 and Nip3-like protein X for the biwnding of B cell lymphoma 2, thereby leading to the induction of autophagy [33]. H2O2 was shown to oxidize autophagy related 4, a protease activated as part of the autophagic activation, and this in turn prevents the delipidation of the Microtubule-associated protein 1A/1B-light chain 3-phosphatidylethanolamine conjugation. The consequence is the maintenance of the autophagosome formation [15,17,21]. Another type of ROS, O2-, is formed upstream of the beclin-1 and class III PI3K and induces autophagy during prolonged starvation [34]. In contrast, autophagic activation serves to reduce the damage by ROS. Atg7-deficient reticulocytes exhibit ROS accumulation and mitochondrial damage [23]. Beclin 1+/--immortalized mouse mammary epithelial cells exhibit an excessive buildup of p62 and intracellular ROS as compared to the wild-type cells [35].
Dormant blastocysts during delayed implantation are exposed to the hypoxic condition of the uterus for many days, and this may work to enhance the production of ROS in these embryos. Thus, the increased levels of ROS in the short dormancy group after 3-MA or wortmannin treatment (Figure 3) suggests the possibility that autophagy in dormant blastocysts act to reduce ROS levels in order to maintain the cellular homeostasis during delayed implantation. This result warrants further investigation as to which molecules are directly involved in such regulatory mechanisms.
In short-term dormant blastocysts, ROS production seems low and the brief inhibition of autophagy with wortmannin did not affect it. However, a longer exposure to 3-MA in vivo clearly increased the ROS level; this strongly implies a role for autophagy in scavenging ROS. We also observed that long-term dormant blastocysts showed higher levels of ROS than short-term dormant blastocysts (Figure 2). Furthermore, the administration of 3-MA to block autophagy in vivo exhibited less prominent effects on the ROS production in long-term dormant blastocysts (Figures 3B and 4C). Thus, it is plausible that ROS accumulates in dormant blastocysts in response to the continuous exposure to the hypoxic condition of the uterus as the length of dormancy increases, and that the extent of ROS accumulation may be beyond the capacity of autophagic clearance within the dormant blastocysts. We previously showed that long-term dormant blastocysts exhibit compromised post-implantation development after implantation [16]. ROS accumulation may be one of the causes of this compromised developmental competence during prolonged delayed implantation.
Acknowledgments
The authors thank the members of the Lim laboratory for their constant support.
Notes
This work was supported by a National Research Foundation of Korea (NRF) grant (No. 2011-0016513) funded by the Korea government (MEST).
No potential conflict of interest relevant to this article was reported.