


Introduction
Improvements in procedural and therapeutic strategies in assisted reproductive technology (ART) have led to a dramatic increase in live birth rates and reduced rates of cycle cancellation [1]. However, poor ovarian response or hyper-response remain limitations. Advances in the design of stimulation protocols with milder properties have reduced the costs of treatment, enhanced oocyte retrieval [2], and led to a significant reduction of the hyper-response rate [3]. Nevertheless, these protocols have been criticized for their possible reduced efficacy in terms of reduced pregnancy and live birth rates [4]. The trade-off between controlled ovarian stimulation (COS) safety and efficacy is further complicated by the complex exposure-response relationship between ovarian response and the gonadotropin dose in each protocol [5]. Therefore, the difficulty in the choosing a stimulation protocol and subsequent gonadotropin dose is a major challenge in designing ART cycles, and it is necessary to personalize COS based on the patient’s specific factors to optimize both the safety [6] and efficacy [7] of the stimulation. Currently published models for personalized gonadotropin therapy have identified women’s age, gonadotropin dosage, and ovarian reserve tests (ORTs), including anti-Müllerian hormone (AMH) levels, follicle-stimulating hormone (FSH) levels, and antral follicular count (AFC), as the most significant predictors of ovarian response [8-11]. Nevertheless, these models have many drawbacks, limiting their validity for application in clinical practice.
First, most of these models define ovarian response as high, good, or poor based on logistic regression models. Different thresholds of ovarian response for each category may potentially bias the predicted response, resulting in misclassification errors [12]. Moreover, modeling the response using categorical variables hides the extensive patterns of variability embedded within each category, resulting in potential information loss [13]. Second, the gonadotropin dose-oocyte relationships have been described using different structural models, with no consensus on which one is optimal. Third, the complex mathematical calculations involved in the final model equations limit the practical application of these models in real-world settings. Fourth, models predicting the probability of COS success in terms of pregnancy rates or live birth rates are potentially confounded by the laboratory phase and luteal phase of embryo transfer, regardless of the specific treatment or clinical factors. Therefore, the current study aimed to test different structural models of the gonadotropin dose-oocyte relationship, to address the limitations of the current models, and to translate the resultant model into an easy-to-use and clinically applicable tool.
Methods
1. Study design
This was an observational, single-center, retrospective cohort study. The study group was split into an index cohort, which was analyzed for model building and optimization, and a validation cohort, which was used for model validation. The candidate women were randomly allocated to these two groups in a 4 to 1 ratio (80% index, 20% validation). Any additional patients included in the analysis phase were assigned to the validation group. The study followed the precepts of the Helsinki Declaration, and was approved by the Ethical Committee of the Faculty of Pharmacy, Helwan University. Written informed consent was obtained from the recruited women.
2. Patients
Women undergoing intracytoplasmic sperm injection (ICSI) between January 2015 and May 2019 at Midwest Reproductive Center (Giza, Egypt) were assessed for eligibility to be included in the study. The inclusion criteria were an adequate trial of spontaneous conception for at least 1 year, the first trial of in vitro fertilization (IVF)/ICSI cycles, and normal menstrual cycle. Patients were excluded if they were more than 40 years old or presented with a secondary cause of female infertility, in order to avoid the potential confounding of their underlying pathologies or special treatment plans with our model. Therefore, women who presented with any explained cause of infertility, including tubal, uterine, or ovarian pathologies, as well as those with neurological or endocrine causes of infertility, were excluded. Moreover, women were excluded if they reported recent administration of hormonal contraceptives within the last 3 months. Since conventional IVF was not available at our center, all candidate women underwent standard IVF/ICSI. Data retrieved from the local center registry included basal FSH measured on day 2–3 of the menstrual cycle, AMH levels, total AFC (including follicles measuring 2–10 mm), the starting and total gonadotropin dose, duration of the stimulation, type of the stimulation protocol, number of metaphase II oocytes, and the total count of oocytes retrieved following COS.
3. Treatment protocols
According to the treating physician's clinical experience, women underwent pituitary desensitization using a long, short, or antagonist protocol. For the long protocol, women were initiated on a gonadotropin-releasing hormone (GnRH) agonist (Triptorelin; Decapeptyl; Ferring Pharmaceuticals, Saint-Prex, Switzerland) on day 20 of the menstrual cycle preceding the stimulation cycle. When pituitary downregulation was attained, as evidenced by a serum estradiol level <50 pg/mL, gonadotropin stimulation was administered as human menopausal gonadotropin (Merional; IBSA, Lugano, Switzerland) or recombinant FSH (Gonal-F; Merck Serono, Switzerland) started at empirical doses determined by the physician based on age, serum AMH levels, and body mass index (BMI) [14]. For the short protocol, a GnRH agonist was started on the first day of the ART cycle; then, gonadotropin doses were started on day 3 until the day of human chorionic gonadotropin (hCG) administration [15]. Finally, women on the antagonist protocol started gonadotropin stimulation doses daily on day 1 of the stimulation cycle (day 2–3 of the menstrual cycle). A GnRH antagonist (Cetrorelix; Cetrotide, Merck Serono, Eysins, Switzerland) with a daily dose of 0.25 mg/day (subcutaneous) was then initiated when at least 1 follicle measured 14 mm and continued until the target follicular response [4]. For each protocol, the starting gonadotropin dose ranged from 150 to 450 IU/day and was modified subsequently if needed on a weekly basis in 75 IU increments according to the results of ultrasonographic follicular tracking. Final oocyte maturation was triggered with hCG (Choriomon, IBSA) administered at a dose of 10,000 U when at least three follicles measured ≥18 mm, and ovum pick-up was then facilitated by transvaginal ultrasonography 36 hours later. Embryo transfer was performed on days 2–4 after pick-up.
4. Ultrasonographic and hormonal measurements
Basal antral follicles were measured in both ovaries by qualified radiographers on day 3 of the menstrual cycle using transvaginal ultrasonography (ClearVue 350; Philips, Louisiana, USA). Longitudinal AFC evaluation 1 week after the start of ovarian stimulation was carried out to guide the incremental gonadotropin dose modification. For hormonal assays, cubital vein blood samples were taken in the early follicular phase (day 3), prior to the start of ovarian stimulation regimens. Serum AMH was analyzed by enzyme-linked immunosorbent assay (ELISA) using the Beckman Coulter AMH ELISA kit (Immunotech, Marseilles, France). Levels of basal FSH were determined in a similar fashion using ELISA (Immulite 2000 analyzer; Siemens, Munich, Germany) on day 3 of the cycle. All samples were analyzed on the day of collection using the same kits and operators to minimize intra-assay variability.
5. Outcomes
The primary outcome investigated was the absolute count of oocytes retrieved following COS in ICSI cycles. The secondary outcomes were the rates of hypo- or hyper-response and the ovarian response prediction index (ORPI). Poor response was defined as the attainment of fewer than eight oocytes at the end of the stimulation cycle, whereas hyper-response was defined as the retrieval of 15 oocytes or more [6]. The ORPI was calculated as (AMH level×AFC)/age [9].
6. Statistical analysis
Continuous data are described as mean±standard deviation or median and interquartile range (IQR), while categorical variables are presented as the count with corresponding percentages (n, %). For comparisons, the Mann-Whitney U-test was used for continuous non-normally distributed data, the t-test for normally distributed data, and the chi-square test for ratios. An a priori alpha of less than 0.05 was set. The process of model development involved a three-step approach: structural model development, building a covariate model, and validation of the final model.
1) Structural model development
The hypothesized models for investigation of the dose-response relationship included modified Poisson, negative binomial, linear, and hybrid Emax models with the log-link function for counts. The hybrid Emax model is a proposed structural model that combines the Emax model [16] and the Poisson model [17] in the same structure to account for non-linearity in the dose-response relationship between FSH doses and oocyte retrieval. The precision of the tested models was evaluated by comparing the estimated percentages of relative standard error (%RSE) calculated for each model. To characterize the interindividual variability, mixed-effect modeling was applied at this stage.
2) Covariate selection
After the determination of the best structural model, potential covariates, including AFC, AMH and FSH levels, age, gonadotropin dose, and protocol type, were tested for their impact on the Akaike information criterion (AIC) of the structural model. Stepwise forward-inclusion covariate modeling was applied. The difference in AIC values between the candidate models was approximately chi-square–distributed and was considered significant when the AIC changed by more than 3.84 when testing a single covariate (χ2, df=1; p=0.05).
3) Model validation
Non-parametric bootstrapping of the original dataset was performed with 500 replicates of the same sample size, and the results were compared to those of the base model. Furthermore, model metrics including the root mean squared error considering the log error model, C-index, chi-square model score, and pseudo-R2 were calculated from the validation group analysis and compared to their corresponding estimates in the index group.
7. Software
Descriptive statistics and group comparisons were performed using IBM SPSS ver. 26.0 (IBM Corp., Armonk, NY, USA). The structural model assessment was performed using Monolix software ver. 2019R2 (Lixoft, Paris, France). Covariate modeling, validation, and nomogram development were performed using R ver. 3.5.0 (R Foundation, Vienna, Austria).
Results
1. Baseline and clinical characteristics
In total, 636 women were enrolled in the present study, with a mean age of 29.87±5.26 years. The median AFC was nine follicles (range, 1–33 follicles), while the mean AMH level was 2.54±1.31 ng/mL (range, 0.6–14.9 ng/mL), and the mean FSH level was 6.88±3.79 mIU/mL (range, 1.2–27.6 mIU/mL). COS was performed using long (32.9%), short (56.6%), or antagonist (10.5%) protocols, resulting in poor (41.5%), normal (50.6%), and hyper-response (7.9%). No patients presented with severe ovarian hyperstimulation syndrome. The starting gonadotropin dose applied in different COS cycles ranged between 150 and 450 IU. The majority of women received a dose of 225 IU (54.6%). The median number of retrieved oocytes at the end of stimulation was 8 (IQR, 6–11), and the mean units required to obtain one oocyte was 35.85±26.96 IU/oocyte. Of the 636 patients, 497 (78%) were assigned to the index group and 139 (22%) to the validation group. Pairwise comparisons between the index group and the validation group demonstrated statistically non-significant differences. Table 1 summarizes the baseline characteristics of the study groups.
2. Structural model building
Among the screened dose-response models, the modified Poisson model (with log-dose) demonstrated the highest parameter precision (λ=8.27, RSE(λ)=2.02%), lowest unexplained interindividual parameter variability (28%; RSE, 7.8%), and the best predictive performance as evidenced by the lowest AIC compared to all other models (AIC, 2,704). Our novel hybrid model demonstrated convincing precision to estimate the Emax and ED50 parameters (%RSE, 2.17% and 0.44%, respectively); however, it was excluded due to an apparently higher AIC (AIC, 2,752). Finally, the linear models presented the worst performance, as shown by the highest AIC and %RSE. A summary of the structural model assessment is provided in Table 2.
3. Covariate selection
Based on the modified Poisson structural model, univariate analysis was performed. Statistical significance was demonstrated for age, AFC, AMH and basal FSH levels, gonadotropin dose, and stimulation protocol type, while BMI was found to be a non-significant predictor (p=0.57). Despite significance in the univariate analysis (p<0.001), AMH was found to be nonsignificant in the multivariate model (p=0.21), possibly due to multicollinearity with other covariates. Centering AMH around the median or correcting the independent variables for AMH resulted in imprecise estimates of model coefficients and poor model stability. Therefore, AMH was dropped from the final multivariate model. The final multivariate regression model identified age, AFC, FSH levels, protocol type, and the starting gonadotropin dose as significant independent predictors of the oocyte retrieval count (Table 3). The gonadotropin dose initially demonstrated a negative relationship with oocyte count in the univariate analysis (regression coefficient, –0.221; p<0.001); however, after adjusting for confounding variables, a positive relationship was shown in multivariate regression (adjusted odds ratio, 1.11; 95% confidence interval [CI], 1.004–1.24).
4. Model validation
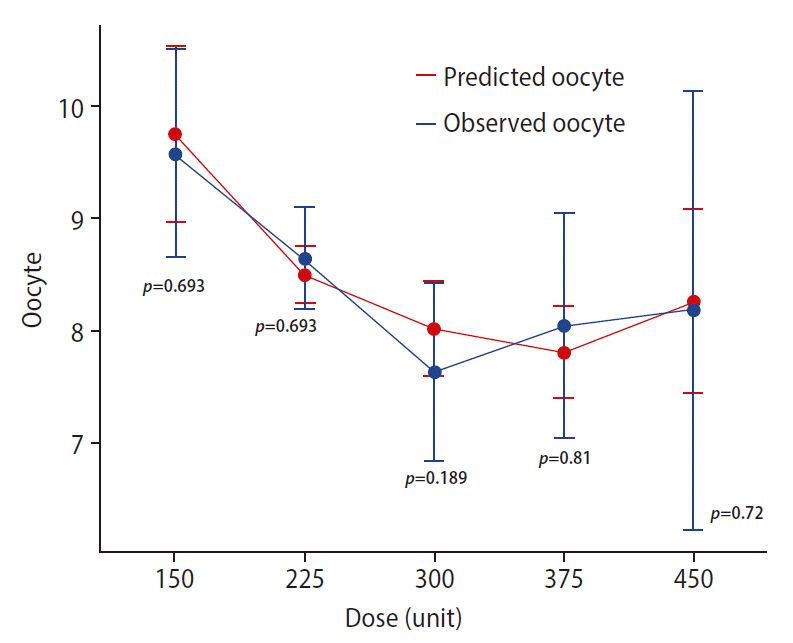
The results obtained from 500 rounds of bootstrapping indicated a close match between the mean coefficients of the bootstrapped samples and those of the original model with little bias. All of the final model coefficients lay within the 95% CI of the mean coefficients estimated from bootstrapping, indicating stable and robust predictive performance of the final model. Table 4 summarizes the results of bootstrapping. Comparing the mean actual versus predicted oocyte count across the different studied gonadotropin doses resulted in nonsignificant differences, confirming the reliability of the model predictions (Figure 1).
The validation group (n= 139) demonstrated similar discrimination criteria compared to the index group (Table 5). For both groups, the developed model explained approximately 50% of the variability in the observed oocyte count (pseudo-R2: 0.48 vs. 0.49 for the index and validation groups, respectively). The concluded model achieved statistical significance when analyzing both groups (p<0.001 for both groups). The C-statistic was reasonable for both models, confirming the agreement between predicted and actual oocyte counts (C-statistic, 0.71 vs. 0.72, respectively). The RMSE estimates for both models were also comparable. The estimated odds of oocyte yield from both models demonstrated a distinct similarity (Figure 2).
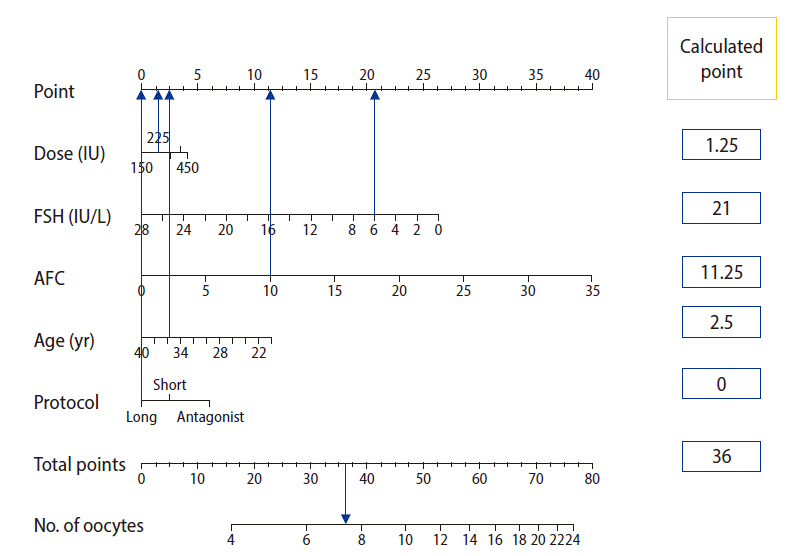
5. Nomogram development
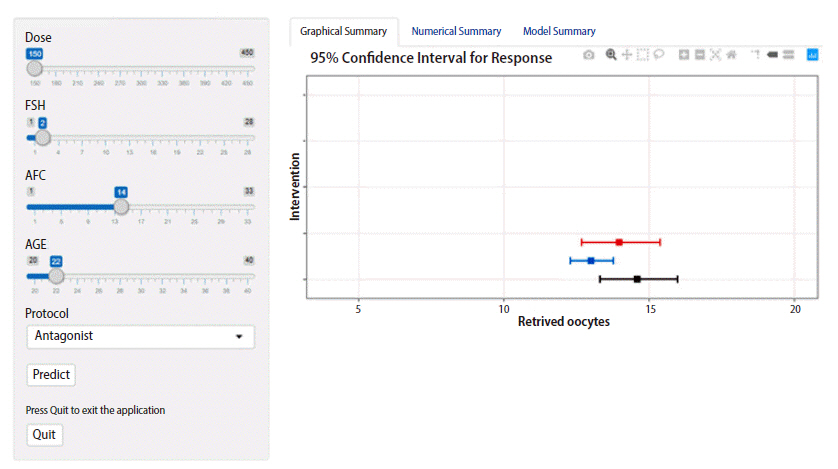
Based on our validated final model, a point-based static nomogram was built to help individualize treatment decisions based on patient-specific characteristics (Figure 3). The prognostic weight of each independent variable is depicted by the length of the corresponding point scale. Gonadotropin dose and protocol type are the shortest scales; hence, they have a lower weight than the other patient-related factors. The nonlinear exposure-response relationship is well-captured by the point system scaling. The points attained from incremental increases of the gonadotropin dose non-linearly decrease as the dose increases; moreover, the total number of points required to increase the oocyte count is much higher in cases with a predicted retrieval of fewer than 8 oocytes than in those with a predicted retrieval of more than 15 oocytes (Figure 3). A dynamic individualization tool was constructed to aid electronic manipulation for more convenient institutional applications (Figure 4).
Discussion
The present study is the first to introduce a nomogram-based clinical tool that can be utilized to individualize both the protocol and the starting gonadotropin dose selection for IVF/ICSI candidates. The nomograms were built based on a robust validated model that predicted the number of retrieved oocytes from the stimulation cycles. In line with many previous studies [8,18,19], the choice of retrieved oocytes as a target outcome to model was suggested in the current work to overcome confounding with different non-therapeutic factors encountered in models predicting IVF/ICSI success in terms of pregnancy or live birth rates. Moreover, the definition of response to COS in terms of absolute oocyte count enables a realistic representation of ovarian response as a continuous spectrum instead of “black and white” categories in binary logistic models for COS individualization [11,12,20,21].
Our developed model identified women’s age, basal FSH levels, AFC, stimulation protocol type, and gonadotropin dose as significant predictors of oocyte retrieval. The prognostic value of each of these identified predictors has been well established in previous reports [8,11,12,22].
One of the main findings of the current model is that treatment-related factors, including the stimulation protocol and gonadotropin dose, may have little influence compared to the patient's intrinsic factors, including age and ORTs, when predicting oocyte retrieval. This suggests that the matter of optimal response to gonadotropin therapy is more related to the patient herself rather than the specific characteristics of the therapeutic approach. Similarly, Rustamov et al. [23] concluded that only 10% of the total observed variance of retrieved oocytes could be explained by treatment-related factors, while 53% could be attributed to patient-specific factors in their mixed-effects Poisson model.
Interestingly, the evaluation of the predictive performance of different ORTs demonstrated superior predictive performance of basal FSH levels compared to AMH levels. Similarly, Magnusson et al. [24] concluded that AMH levels did not improve the rates of targeted ovarian response when added to AFC. Nevertheless, the results of similar analyses should be interpreted with caution, especially when comparing our results, due to differences in sample sizes, the inclusion of confounding conditions (e.g., polycystic ovaries), and application of different stimulation protocols. For instance, Moon et al. [19] reported that age, basal FSH levels, AFC, and AMH levels were significant predictors of the oocyte count; however, in their final model, they excluded FSH due to its relatively weak predictive performance. This low weight of basal FSH may be related to their relatively small sample size (n=141), and the high inter-subject variation that was encountered with FSH levels in their work (range, 2.9–26.6 mIU/mL; coefficient of variation, 45%) [19].
In particular, the impact of gonadotropin dose on oocytes remains debatable. It was suggested that a positive relationship may exist between gonadotropin doses from 50 IU to 225 IU and oocyte yield, whereas doses more than 225 IU failed to demonstrate an extra benefit, indicating a possible nonlinear relationship [26]. Possible explanations for this phenomenon include limited capacity of the follicular pool, large variability in the AFC, and/or sensitivity to exogenous gonadotropin stimulation [27]. Unfortunately, the characterization of the nonlinear dose-response relationship has largely been overlooked in previous similar reports. It is therefore not surprising that our results identified the linear models as the worst ones, highlighting a major criticism of the currently published linear regression models for gonadotropin dose individualization [28-30]. In the current study, two possible models were proposed to capture these nonlinear patterns: hybrid Emax and modified Poisson models. In pharmacodynamic terms, the Emax model assumes that a drug has a maximum effect at a certain dose, while beyond this dose, no additional response will be obtained. The Emax model is parameterized with Emax, a metric for the average maximum response with escalating FSH doses, and ED50, a metric that corresponds to the dose that yields half of the maximum response [31]. The idea behind our proposed hybrid Emax model is that the traditional version of Emax predicts continuous responses, which is not suitable for modeling oocytes as discrete outcomes [16], while the Poisson model correctly predicts oocyte count as a discrete variable, but assumes a linear relationship between FSH dose and oocyte count, which is not true [19]. In the proposed hybrid model, we replaced the traditional exponential linear function with the exponential nonlinear Emax function to account for the relatively flat dose-response relationship attained at higher FSH doses, while enabling oocytes to be predicted as discrete counts. In contrast, the proposed modified Poisson model introduced the FSH dose covariate in log terms instead of the linear scale implemented in conventional Poisson models to account for the nonlinear FSH dose-oocyte count relationship. Comparing both models, the modified Poisson model demonstrated the best fit with the highest precision and showed a significant effect of gonadotropin dose on oocytes (p=0.042).
In contrast to our results, a recent meta-analysis concluded that escalating FSH doses had similar efficacy and safety profiles in both poor and hyper-responders. However, the authors reported that the included studies might have suffered from limited sample sizes and heterogeneous comparisons of different doses of FSH [32]. Borges et al. [29] demonstrated that escalating doses of FSH were not associated with an increased oocyte count. However, they reported lower FSH requirements per oocyte retrieved at a younger age (≤35 years), suggesting that the impact of gonadotropin dose on oocytes may be masked by intrinsic poor ovarian function, primarily due to aging .
Regarding the protocol type, our findings indicate that milder protocols were associated with higher oocyte yield than the conventional long stimulation protocol. This finding is supported by Pinto et al. [20], who found that antagonist protocols were associated with a significantly higher mean number of retrieved oocytes than long protocols. In contrast, three different meta-analyses reported statistically significant lower oocyte yields with antagonist protocols than with agonist (long) protocols [33-35]. Of note, Lambalk et al. [35] demonstrated a non-significant difference among protocol types in poor responders, supporting our theory that the intrinsic response to gonadotropins is basically related to the characteristics of the patient herself. To our knowledge, no study has adjusted for the effect of the higher gonadotropin doses involved in the long protocol. It should be noted that the longer duration of stimulation, with the subsequent higher total gonadotropin dose per cycle in the long protocol, may potentially confound this relationship [14]. Whether a higher oocyte count is related to the specific type of stimulation or the higher gonadotropin dose in the long protocol remains questionable.
To translate models into practice, nomograms provide rigorous tools for model visualization, helping clinicians to optimize treatment decisions on an individual basis [36]. The nomogram-based model for oocyte prediction previously introduced by La Marca et al. [8] was limited by the analysis of a homogeneous group of predicted normal responders only, with a single stimulation protocol (long protocol only). In contrast to our model findings, they demonstrated enhanced predictive performance of their multivariate linear model, which reached up to 50% correct FSH dose prediction in predicted normal responders aged less than 35 years. Moreover, the external validation of the nomograms developed by La Marca et al. [8] resulted in acceptable performance in individualizing FSH doses [7,37]. This suggests that the application of linear models in predicting a suitable gonadotropin dose may be appropriate when analyzing a more homogeneous population of predicted normal responders. Despite comparable predictive performance, our results should be interpreted with great caution when compared to the findings of La Marca et al. [8] due to the implementation of a different dose-response model and the analysis of a more heterogeneous group that included different patterns of response other than predicted normal response. More recently, Moon et al. [19] presented an appropriate oocyte model in terms of Poisson regression for counts; however, their nomogram was criticized for failure to interpret the contributions of both protocol type and gonadotropin doses to oocyte retrieval due to their relatively small sample size.
Taken together, the current study exhibits several strengths. First, the fitted model adequately describes the complex nonlinear relationship between gonadotropin doses and oocyte retrieval. Second, the developed model dealt with the large heterogeneity in the definitions of ovarian response by modeling the response to COS as the absolute oocyte count. Third, the developed nomogram is user-friendly and does not require the user to apply any sophisticated mathematical or statistical techniques, as were used in the process of model building. Fourth, our nomogram is the first to introduce a method for integrated gonadotropin therapy personalization, enabling both the protocol and subsequent gonadotropin dose to be tailored. Nevertheless, the current work has several limitations. Since external validation was not possible during the development phase, the generalizability of the proposed nomogram remains unknown. The exclusion of women with explained causes of female infertility further limits the generalizability of the developed nomogram. The model used for oocyte retrieval did not account for intra-cycle variability due to its dependence on baseline clinical and demographic characteristics only. Additionally, the literature has presented many factors that may have an influence on oocyte prediction, including estradiol levels, FSHR gene polymorphisms, and smoking status, which were unavailable for the included women during the data collection phase. Since the study population included only naïve IVF/ICSI candidates, the role of previous stimulation cycles in predicting oocyte count could not be investigated in the current work. The retrospective nature of the study may pose a threat of information bias. The retrospective design allowed data collection from a relatively large population for optimal model building. The exact predictive performance of the total gonadotropin doses administered during the entire cycle could not be investigated due to a lack of monitoring of patient adherence to the prescribed gonadotropin therapy, which might have resulted in mismatching between the recorded doses and the actual administered doses. Similarly, this point could be raised to criticize previous studies [19,38], which assessed the effect of total gonadotropin doses on ovarian response without reporting how patient adherence was monitored, introducing a risk of potential information bias [39]. Future studies should apply intensive monitoring schedules for different ORTs during IVF/ICSI cycles for further validation of our nomograms with more detailed data collection to address all possible sources of oocyte yield variability.